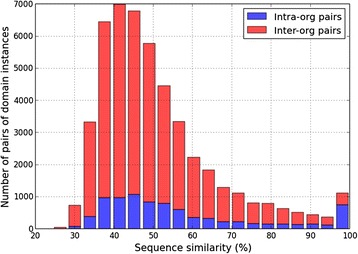
Fig. 6.

Diversity on the sequence level within domain families. Histogram of the percentage sequence similarity values resulting from all-vs-all pairwise alignment of members assigned to a common domain. The distribution represents the aggregate of a random selection of 50 Pfam domains with 30–60 members in each family
