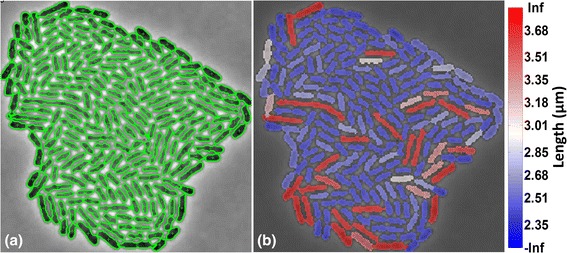
Fig. 12.

Cell attribute visualization. a BaSCA segmentation results for colony 3 of the SalPhase movie (frame 86). Green curvatures mark the contours of segmented cells. b Cell length visualization using color, overlaid on each segmented cell. Movies of cell length visualization are provided in Additional file 4 and 5 for SalPhase and Multi-SalPhase datasets respectively
