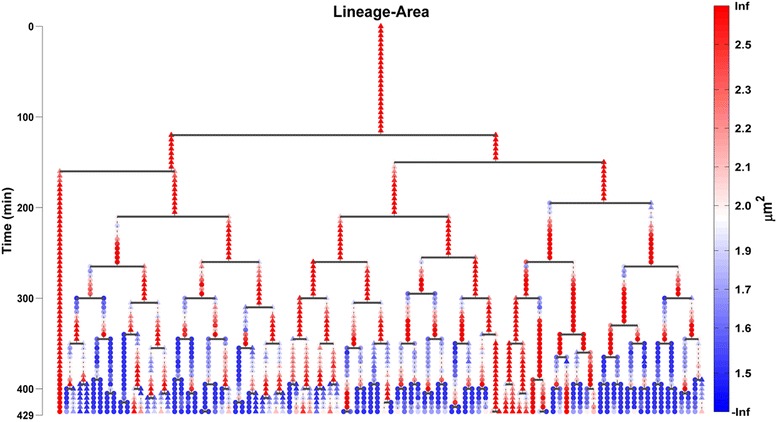
Fig. 13.

Single-cell attribute evolution visualization on the lineage tree. The lineage tree of colony 1 (top left) of the SalPhase movie. The area attribute is visualized using color on the tree for every cell and time instant (frame) of the movie. Triangular (circular) shape node glyphs are used for time instants that a cell lies in the colony’s boundary or within the colony respectively. Any cell attribute available in the database produced by the image analysis can be visualized in the same manner
