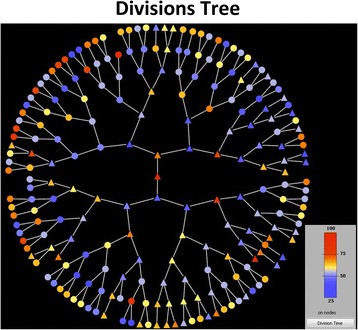
Fig. 14.

Cell life attribute visualization on the cell divisions tree. A circular tree of cell divisions (root cell in the middle) for colony 3 of the SalPhase cell movie. Colors represent here division times (min) as indicated by the color bar. We can easily assess visually how division times vary along tree branches (cell clones) and tree levels (cell generations). Triangular (circular) nodes represent cells that lie on the colony’s boundary (within the colony) respectively. Any cell life attribute available in the database produced by the image analysis can be visualized in the same manner. The Figure was created using the Tulip software package [67]
