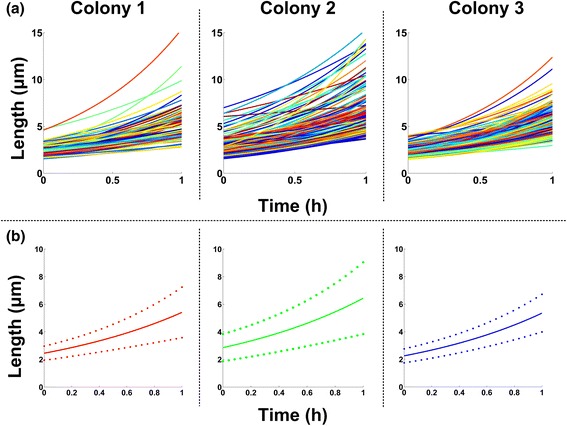
Fig. 15.

Single-Cell Exponential Growth curves. a Single-cell growth curves estimated from the image-analysis data after fitting an exponential individual cell length model (see text for details). Different colors represent different single-cell lifespan trajectories. b Average cell growth curves of each colony (solid lines). Dashed lines represent one standard deviation above and below the average curve. We observe that cell growth exhibits considerable variability among colonies, and cells within the same colony (SalPhase cell movie)
