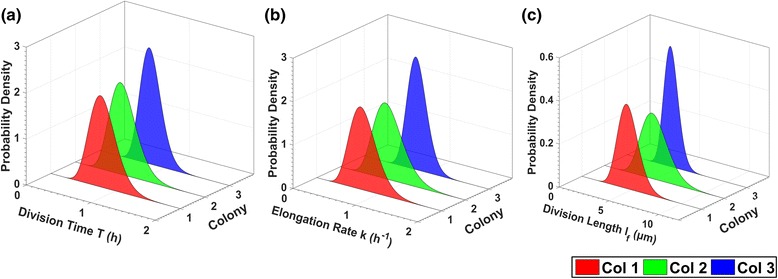
Fig. 16.

Life attributes variability per colony. Gamma distributions (best fit) of (a) the cell division time T, (b) the cell elongation rate k, (c) the cell division length l f for colonies 1, 2 and 3 (SalPhase movie). The proposed methodology allows us to characterize the variability of cell life attributes across colonies. Similar analysis can be performed for any life attribute available in the database after image analysis using BaSCA
