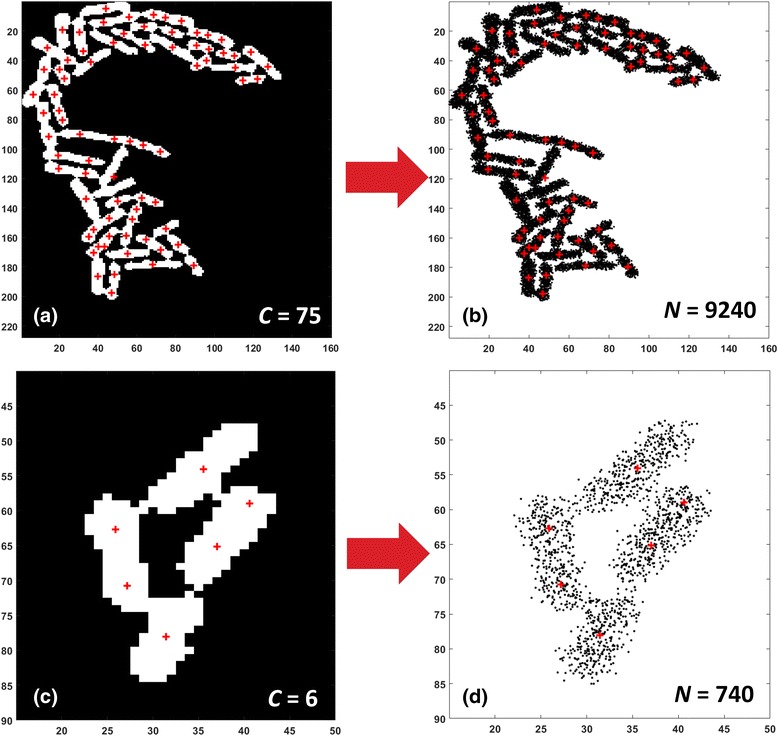
Fig. 6.

Complex object Analysis - Generation of a dataset representing the object. a A very complex object (large number of cells) including potentially 75 single-cells. b Data points generation for the object in (a) by random sampling (see text for details), 9240 data points generated. c A less complex object with only 6 potential cells. d Data points generation for object in (c), 740 data points generated. The number of generated data points is proportional to the number of the complex object centroids, thus it depends on the object’s structural complexity (number of potential cells included). Also, more data points are randomly “thrown” around the cells’ medial axes, so as to best represent cell structures (see text for details)
