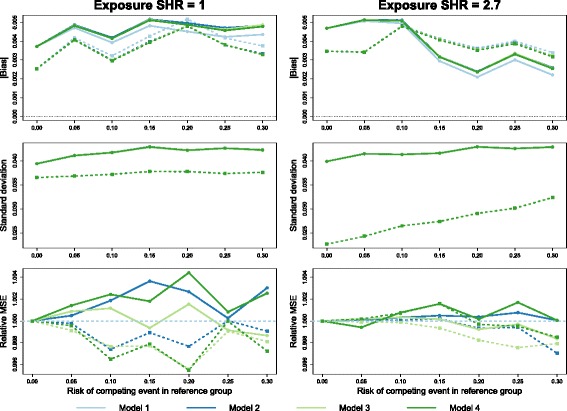
Fig. 5.

Simulations 2: differential censoring by age. Empirical absolute bias (top), standard deviation (middle) and relative mean-squared error (bottom) of the product-limit form of the subdistribution estimator in each exposure group (A: solid / B: dotted) with weights calculated using four different censoring estimates: pooled (model 1), separated by age (model 2), separated by treatment (model 3) and separated by age and treatment (model 4). Simulated loss to follow-up times were drawn from an exponential distribution such that all subjects had a 10% risk of being censored in this way. The true exposure effect was zero in the left-hand column and a SHR of 2.7 in the right-hand column
