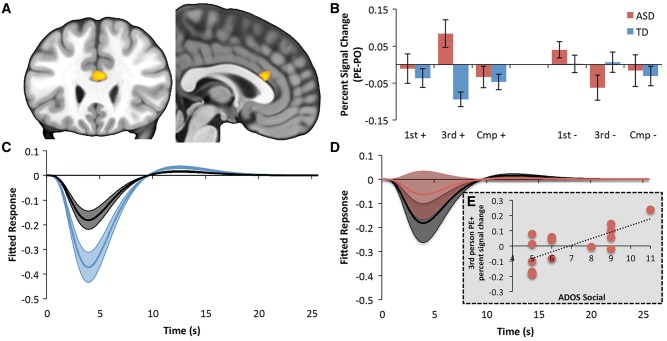
Figure 2.
Group differences in social prediction error signalling. (A) Group × Belief × Agent interaction in the ACCg [Area 24 (78%; Neubert et al., 2015); MNI: 3 26 20, thresholded at P < 0.001 uncorrected] time-locked to the privileged information cue (Fig. 1B). (B) Per cent signal change values from the ACCg showing Agent specific prediction errors (prediction error − predictable outcome). first+, third+ and Cmp+ refer to positive outcome trials for first person, third person and Computer trials, respectively. first−, third− and Cmp− refer to negative outcome trials for first person, third person and Computer trials, respectively. This highlights that BOLD differences in the ACCg were driven by third person unexpected rewards (third prediction error positive) compared to all other trials. (C) Fitted responses from the ACCg for third person prediction error positive (blue) and third person predictable outcome positive (black) in TD subjects. (D) Fitted responses from the ACCg for third person prediction error positive (red) and third person predictable outcome positive (black) in ASD. This highlights that the third+ response in ASD in B was driven by larger responses to third predictable outcome positive trials rather than third prediction error positive trials (also see Supplementary Fig. 2). (E) Scatter plot showing the significant correlation (r = 0.66) between third person prediction error positive per cent signal change values and social symptom severity in ASD.

