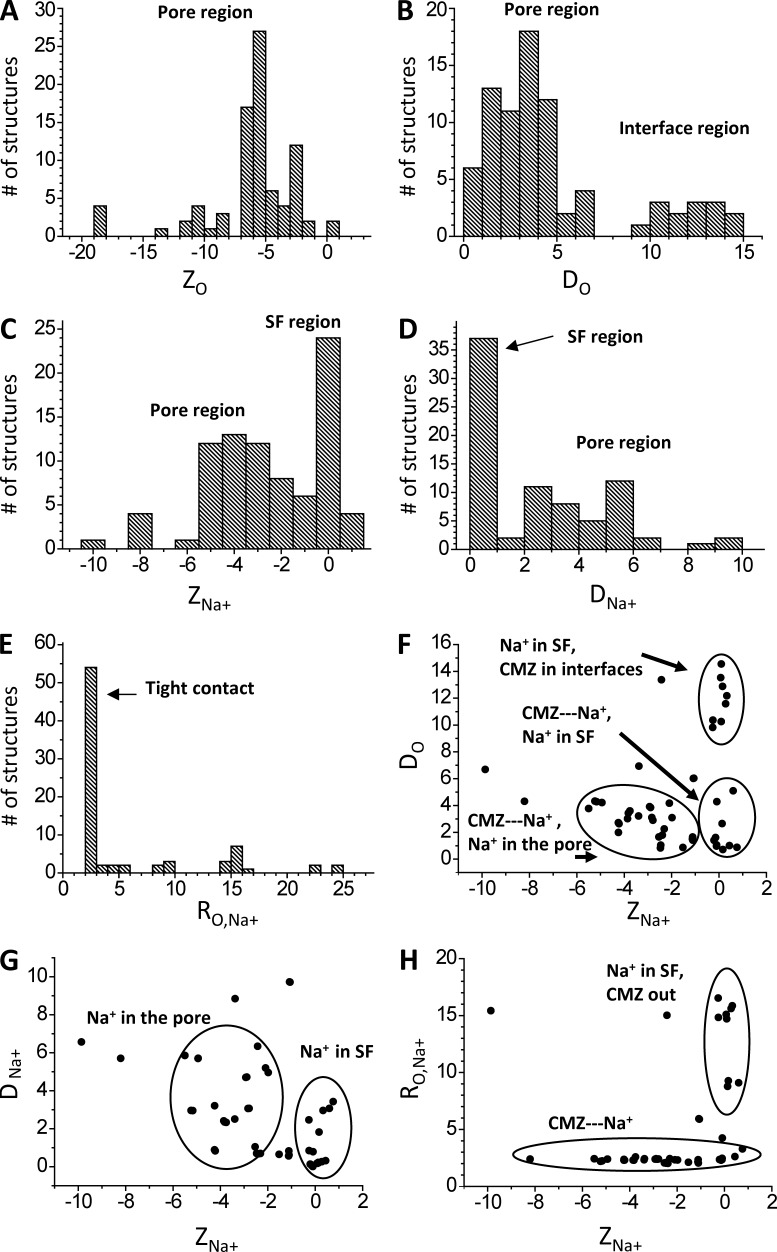
Figure 5.
Statistics of CMZ and Na+ binding in the channel model. Each binding mode is characterized by the Z-coordinates of carbonyl oxygen, ZO, and sodium ion, ZNa, as well as deviations of these atoms from the Z-axis, DO and DNa. (A–E) Distributions of the characteristics of the ensemble of low-energy binding modes. (F–H) Correlation fields between the characteristics. All coordinates and distances are given in angstroms.

