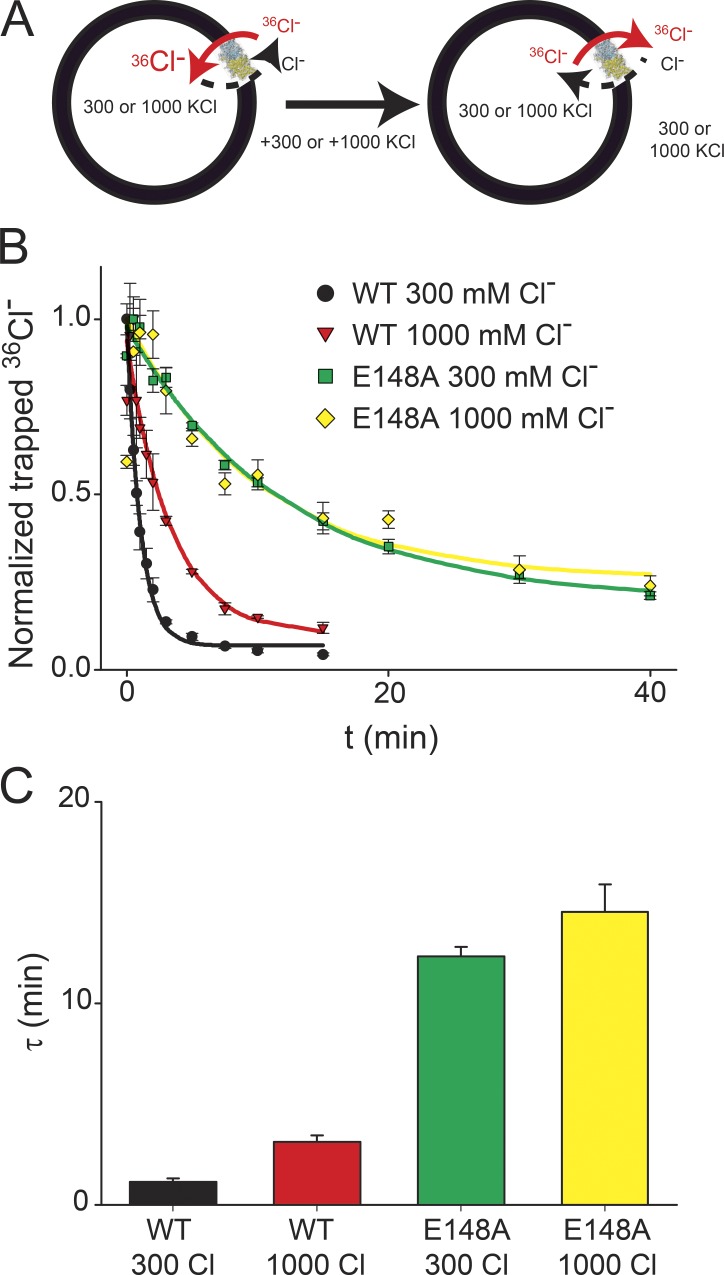
Figure 2.
Mutation of Gluex relieves the high salt inhibition. (A) Schematic representation of the 36Cl− efflux experiments. (B and C) Time course of 36Cl− efflux from proteoliposomes reconstituted with WT CLC-ec1 at 300 mM Cl− or at 1,000 mM Cl− or with the E148A mutant at 300 mM Cl− or at 1,000 mM Cl−. Solid lines represent exponential fits of the time courses with time constants (shown in C) of τWT(300 Cl) = 1.15 ± 0.18 min, τWT(1,000 Cl) = 3.12 ± 0.32 min, τE148A (300 Cl) = 12.3 ± 0.5 min, and τE148A(1,000 Cl) = 14.5 ± 1.4 min. Symbols represent the mean from four independent experiments, and the error bars are the SEM.

