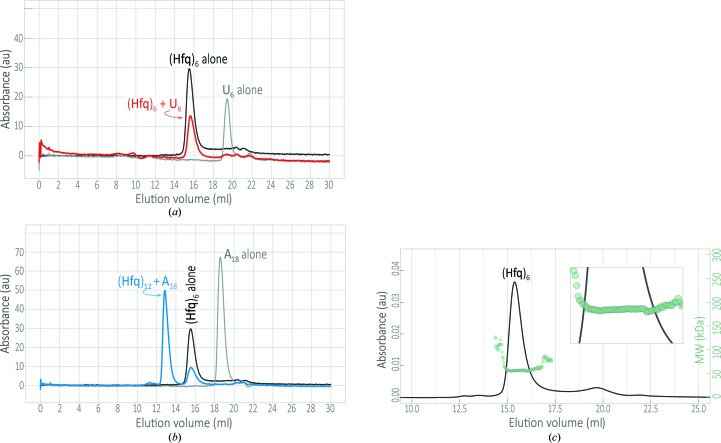
Figure 3.
The solution-state distribution of Aae Hfq oligomers shifts in the presence of short RNAs. Elution profiles are shown for analytical size-exclusion chromatography of Aae Hfq samples incubated with either (a) U6 or (b) A18 RNAs [specifically, 250 µM Aae Hfq was incubated in a 1:1(v:v) ratio with 50 µM of either U6 or A18 RNA]. The elution of Aae Hfq was detected via the absorbance at 280 nm (A 280), and RNA and Hfq·RNA complexes were monitored at A 260. While putative Hfq⋯U6 interactions do not appear to shift the oligomeric state, as indicated by the close alignment of the black (Hfq alone) and red (Hfq·U6) peaks in (a), Hfq interactions with A18 do shift the oligomeric species towards a higher-order state [blue arrow in (b), denoting apparent dodecamers]. This shift could correspond to the simultaneous binding of A18 to two Hfq hexamers, potentially via two modes: (i) as an (Hfq)6·A18·(Hfq)6 ‘bridged’ complex or (ii) as A18 bound to one of the two distal faces that would be exposed on an independently stable (Hfq6)2 double-ring dodecamer. These two models cannot be distinguished via AnSEC. (c) To verify the molecular weight of the Aae Hfq elution peak, the protein was analysed via SEC fractionation followed by multi-angle static light-scattering and refractive-index measurements. The SEC elution profile (black trace) is taken as the absorbance at 280 nm. Light-scattering and refractive-index data can be used to compute molar masses, and the open circles shown here (semi-transparent green) are the molar-mass distribution data [i.e. masses (in kDa) as a function of elution volume]. The weight-averaged molecular weight, M w, of the Hfq sample is computed for the entire peak from this distribution, and the scale is given by the vertical axis on the right-hand side (green numbers; note that this scale applies to the main plot, not the inset). The apparent M w that was computed, 58.75 kDa, corresponds to a hexameric assembly of Aae Hfq.

