Figure 3.
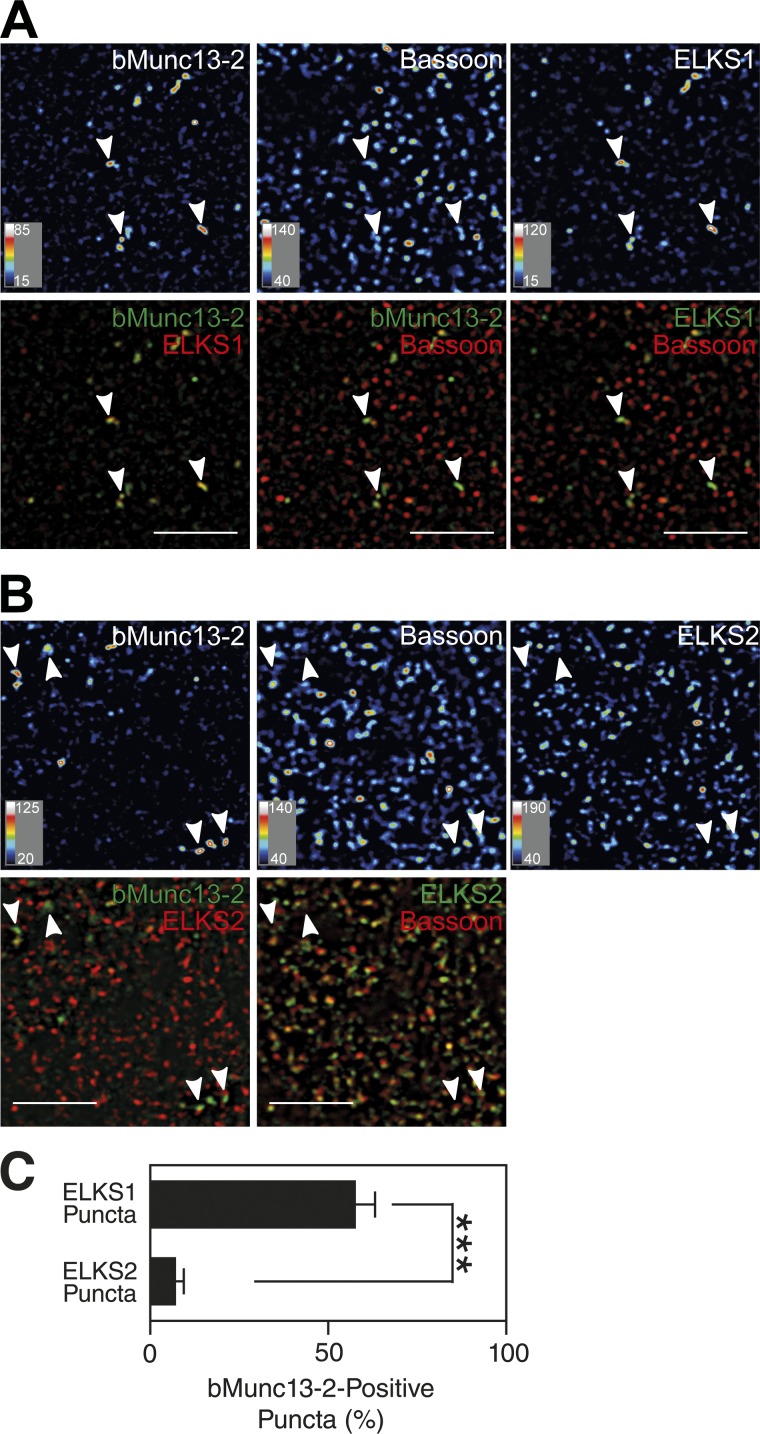
bMunc13-2 is preferentially localized to ELKS1-enriched synapses. (A and B) Localization of endogenous bMunc13-2, ELKS1, and Bassoon (A) and of bMunc13-2, ELKS2, and Bassoon (B) in the WT mouse cortex. Note that bMunc13-2 shows a similar distribution pattern to that of ELKS1 with a restriction to a limited number of synapses (arrowheads in A and B), whereas ELKS2 is accumulated in most Bassoon-positive AZs (B). Bars, 5 µm. For images represented as heat maps, quantitative score scales are presented at the bottom left of the respective image. (C) Quantification of the percentage ELKS1- and ELKS2-positive synapses containing bMunc13-2. Data are means ± SEM and were analyzed by Student’s t test (n = 15 images; ***, P < 0.001).

