Figure 7.
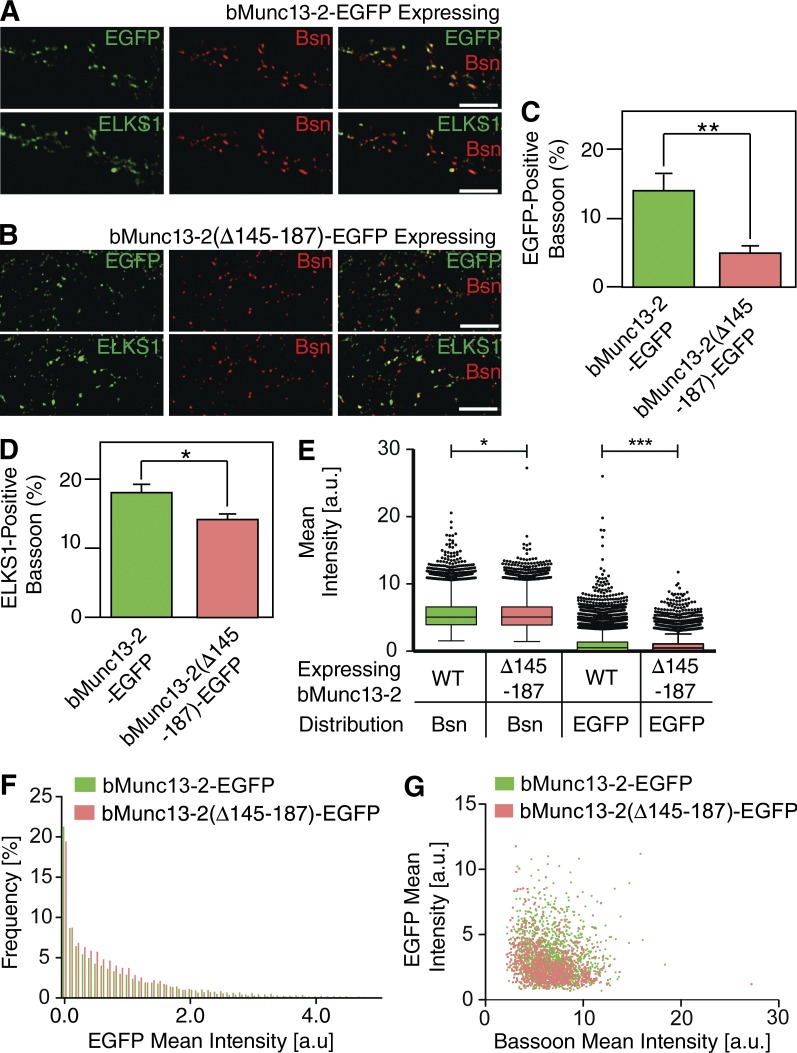
ELKS binding regulates the recruitment of bMunc13-2 to AZs in cultured hippocampal neurons. (A and B) Munc13-1/2 DKO neurons expressing the indicated bMunc13-2–EGFP fusion constructs. Neurons were costained for GFP, ELKS1, and Bassoon. bMunc13-2–EGFP expressed in Munc13-1/2 DKO neurons formed punctate structures and colocalized with immunostained Bassoon (A), whereas bMunc13-2(Δ145–187)–EGFP puncta showed only partial colocalization with Bassoon (B). Note that ELKS1 showed colocalization with Bassoon in A and B. Bars, 5 µm. (C and D) Quantification of the fractions of EGFP-positive (C) and ELKS1-positive (D) Bassoon spots in neurons expressing bMunc13-2–EGFP or bMunc13-2(Δ145–187)–EGFP. n > 25,000 spots were analyzed for EGFP, ELKS1, or Bassoon. Student’s t test (**, P < 0.01; *, 0.01 < P < 0.05). (E) Tukey box and whisker plot for mean intensities of EGFP and Bassoon signals (Bsn) in Bassoon spots of cultured neurons expressing bMunc13-2–EGFP (green) or bMunc13-2(Δ145–187)–EGFP (red). Boxes represent values from upper and lower quartiles, horizontal lines represent medians, vertical lines cover 99% of all values, and outliers are represented as filled circles. Bassoon puncta intensities show a slight reduction in bMunc13-2(Δ145–187)–EGFP-expressing neurons as compared with Munc13-2–EGFP-expressing neurons (5.441 ± 0.016, n = 16,850 in Munc13-2–EGFP-expressing neurons; 5.391 ± 0.015, n = 18,208 in Munc13-2(Δ145–187)–EGFP-expressing neurons; *, P = 0.0173). EGFP signals show a stronger intensity reduction in bMunc13-2(Δ145–187)–EGFP-expressing neurons than Munc13-2–EGFP-expressing neurons (0.991 ± 0.010, n = 16,850 in Munc13-2–EGFP-expressing neurons; 0.770 ± 0.007, n = 18,208 in Munc13-2(Δ145–187)–EGFP-expressing neurons; ***, P < 0.001). (F) Frequency distributions of EGFP signal intensities in Bassoon spots in bMunc13-2–-EGFP- (green) or bMunc13-2(Δ145–187)–EGFP-expressing (red) neurons. Note that bMunc13-2–EGFP-expressing neurons have a small fraction of Bassoon spots with high EGFP intensity. n = 16,850 for bMunc13-2–EGFP-expressing neurons and n = 18,208 for bMunc13-2(Δ145–187)–EGFP-expressing (red) neurons. (G) Scatterplots showing relationships between mean intensities of EGFP and Bassoon signals in bMunc13-2–EGFP- (green) or bMunc13-2(Δ145–187)–EGFP-expressing (red) neurons. Mean intensities were quantified from Bassoon and EGFP colocalizing spots. n = 1,549 for bMunc13-2–EGFP-expressing neurons and n = 895 for bMunc13-2(Δ145–187)–EGFP-expressing (red) neurons. Data are means ± SEM.

