Figure 8.
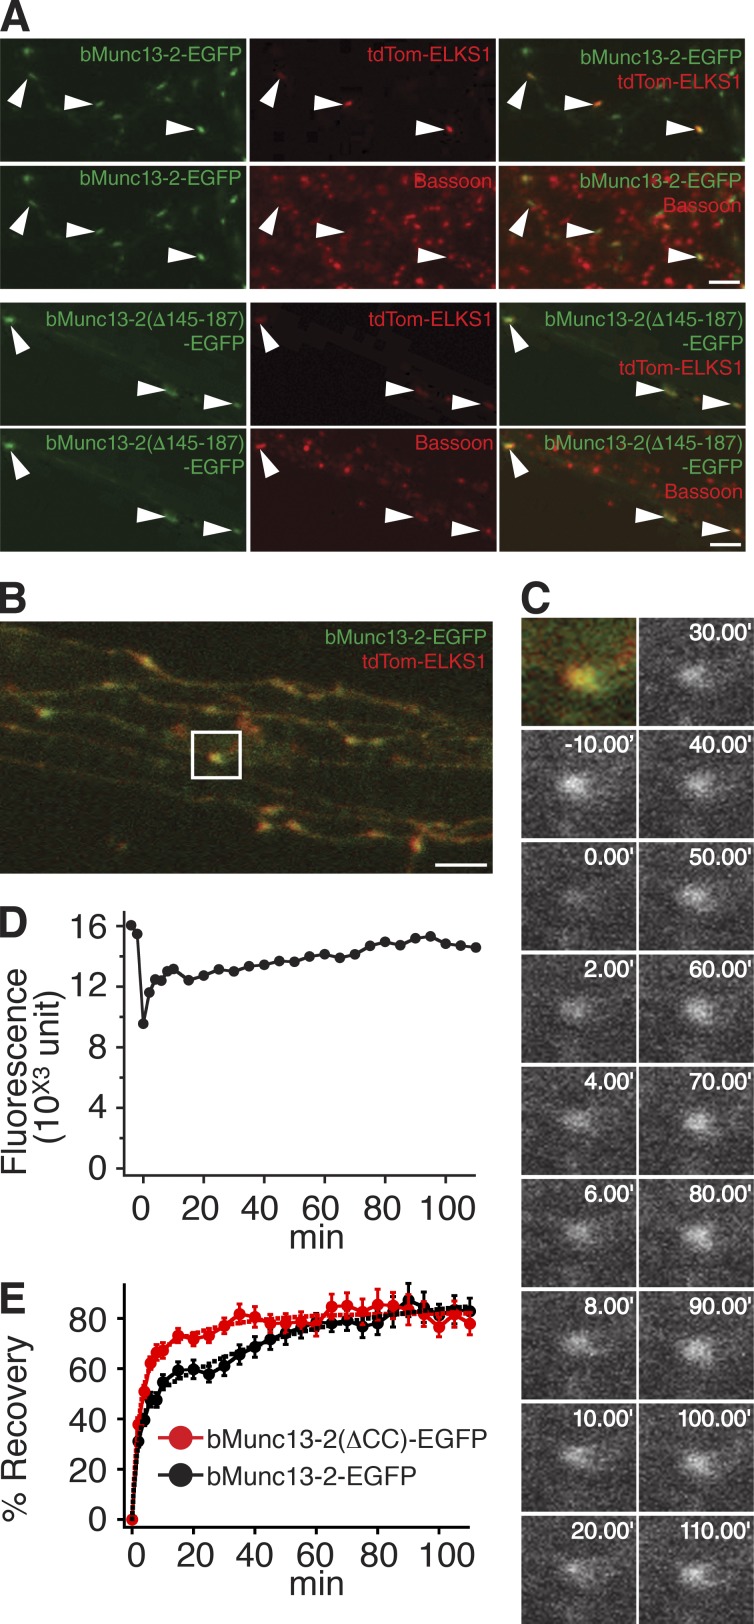
ELKS binding anchors bMunc13-2 to AZs in cultured hippocampal neurons. (A) Representative three-channel images of neurons expressing bMunc13-2–EGFP (top two rows) or bMunc13-2(Δ145–187)–EGFP (bottom two rows) together with tdTom-ELKS1. Neurons were fixed and stained with an anti-Bassoon antibody. Note that most of the recombinant bMunc13-2 signals colocalizing with tdTom-ELKS1 were accumulated at Bassoon-positive AZs (arrowheads). Bars, 5 µm. (B) Overview of axonal terminals imaged in the FRAP experiment in C. The region of interest for the FRAP experiment is indicated by the white box. Bar, 5 µm. (C) Images of a representative FRAP experiment with bMunc13-2–EGFP in Munc13-1/2 DKO neurons. The synapse was bleached, and images were obtained at 2-min intervals for the first 10 min after bleaching and subsequently at 5-min intervals. Images are shown at 10-min intervals after the first 10 min. (D) Time course of FRAP at the synapse shown in C. (E) Mean FRAP time course of the indicated bMunc13-2–EGFP constructs at synapses in Munc13-1/2 DKO neurons. The fluorescence recovery of bMunc13-2(Δ145–187)–EGFP was faster as compared with that of bMunc13-2–EGFP. Solid lines are mean traces measured for the two constructs. Dashed lines are results of fitting with two exponential curves. Data for bMunc13-2–EGFP are from 31 synapses (nine cells), and data for bMunc13-2(Δ145–187)–EGFP are from 31 synapses (seven cells). Data are means ± SEM.

