Figure 9.
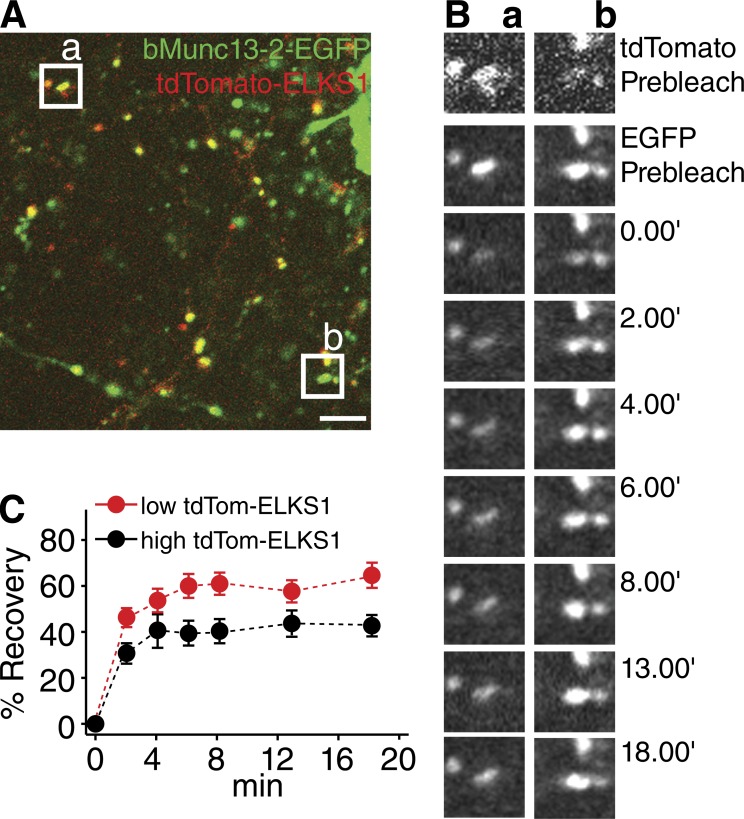
Turnover of bMunc13-2 at AZs depends on ELKS1 levels. (A) Overview of axonal terminals imaged in the FRAP experiment in B. The regions of interest for the FRAP experiment are indicated by white boxes (a and b). Bar, 5 µm. (B) Representative images of tdTom-ELKS1 (top) and bMunc13-2–EGFP (second panels from top) before bleaching and recovery of EGFP signals along the time course at synapses with high (a) or low (b) tdTom-ELKS1 levels. (C) Mean FRAP time courses of bMunc13-2–EGFP at synapses with high (black, n = 22) or low (red, n = 22) levels of tdTom-ELKS1. Note the more rapid recovery of bMunc13-2–EGFP at synapses with low levels of tdTom-ELKS1 in B and C. Data are means ± SEM.

