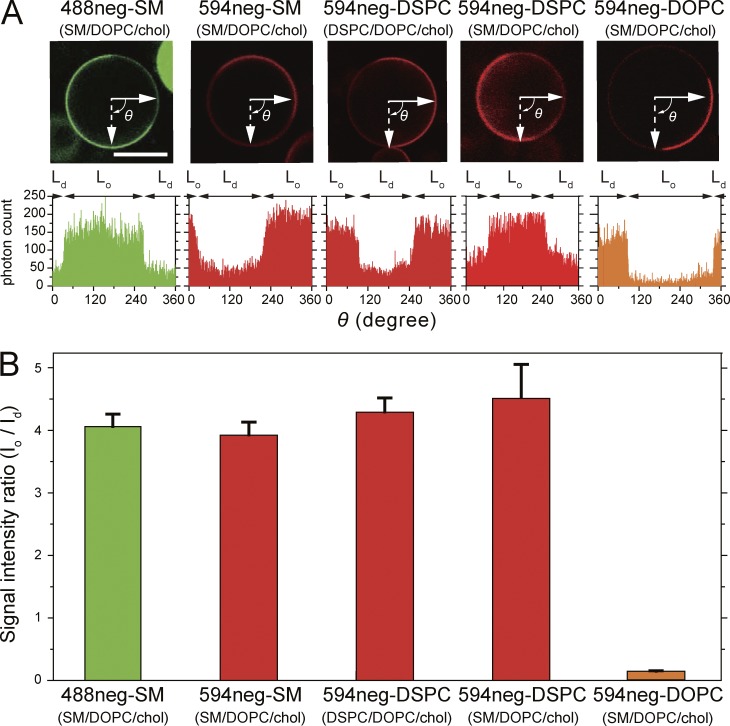
Figure 3.
Quantitative analysis of confocal fluorescence microscopic images. In Lo-Ld phase–separated GUVs, 488neg-SM, 594neg-SM, and 594neg-DSPC preferentially partitioned into Lo domains at levels similar to that of deuterated SM (observed by solid-state NMR), whereas 594neg-DOPC preferentially partitioned into Ld domains. (A, top) Typical confocal fluorescent micrographs of the equatorial planes of Lo-Ld phase–separated GUVs (top). Bar, 20 µm. (bottom) Fluorescence signal intensity profiles along the equatorial circumferences of the GUVs are shown above. 594neg-DSPC was examined in Lo-Ld phase–separated GUVs consisting of SM(18:0)/DOPC/cholesterol and those made of DSPC/DOPC/cholesterol (1:1:1 by moles). (B) Ratio of the mean fluorescence signal intensity in the Lo domain versus that in the Ld domain (Io/Id), based on the signal intensity profiles shown in A (mean ± SE; n = 22, 15, 21, 22, and 21 GUVs from left to right).

