Figure 4.
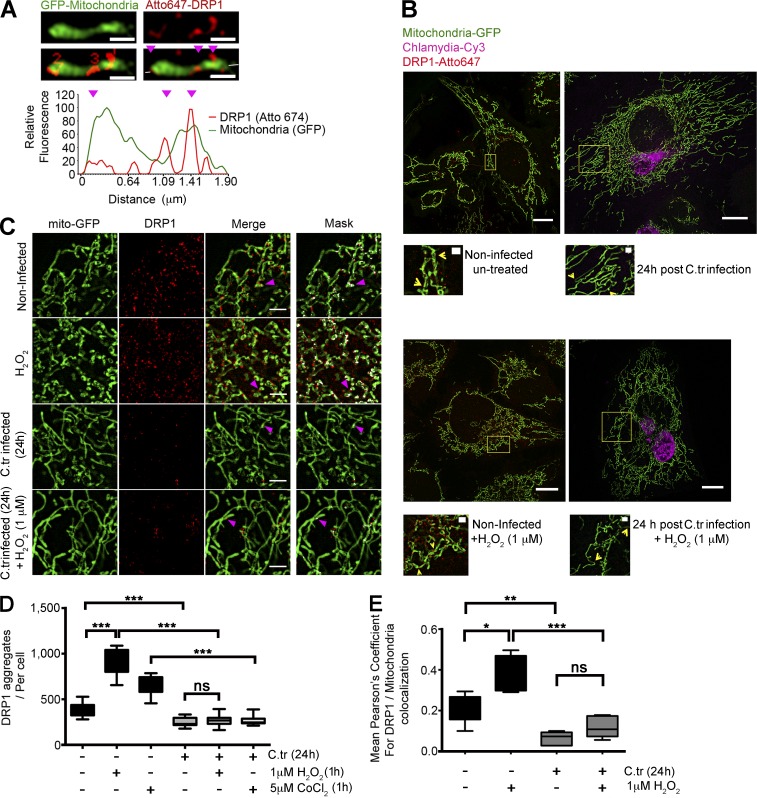
C. trachomatis infection inhibits accumulation of Drp1 aggregates on the mitochondrial surface. (A) Graph represents fluorescence intensity profile plot of a mitochondrial fragment (green) with Drp1 aggregates (red) on constriction sites (magenta arrowheads). The number of Drp1 aggregates was quantified, and intensities in both channels were measured along the depicted axis (white line in the last panel through the fragment). Bars, 1 µm. (B) Structured illumination micrographs of mito-HUVECs infected with C. trachomatis (C.tr; stained against cHSP60; Cy3), treated with 1 µM H2O2 for 1 h, or treated with 1 µM H2O2 for 1 h after 24 h of C. trachomatis infection. The samples were probed against Drp1 and stained with Atto647N. Bars, 10 µm. Zoomed insets (yellow boxes) show DRP 1 aggregation at mitochondrial constriction sites. Bars, 1 µm. (C and D) Quantification of Drp1 aggregates (sizes 100 to 280 nm) in C. trachomatis–infected and uninfected HUVECs. Indicated samples were treated with 1 µM H2O2 for 1 h or treated with 1 µM H2O2 for 1 h after 24 h of C. trachomatis infection. Number of Drp1 aggregates per cell (± SD) for noninfected and infected cells was 377.2 ± 65.86 and 251.8 ± 46.44 (∼60 cells were analyzed from random selection of 20 regions of interest [ROIs] in each sample). 2 or 3 random 10 × 10-µm ROIs were chosen in each selected cell. Significance was determined by Mann–Whitney test; n = 10). (C and E) Structured illumination micrographs and graph represent colocalization analysis (Pearson’s coefficient) between Drp1 and mitochondrial GFP using the COLOC2 plugin; ∼20 cells were analyzed per sample. 2 or 3 random 10 × 10-µm ROIs were chosen in each selected cell. n = 10). Bars, 2 µm. All data represent mean ± SD. Asterisks denote significance by Student’s t test. *, P < 0.05; **, P < 0.01; ***, P < 0.001; ns, nonsignificant. See also Figs. S2 and S3.

