Figure 5.
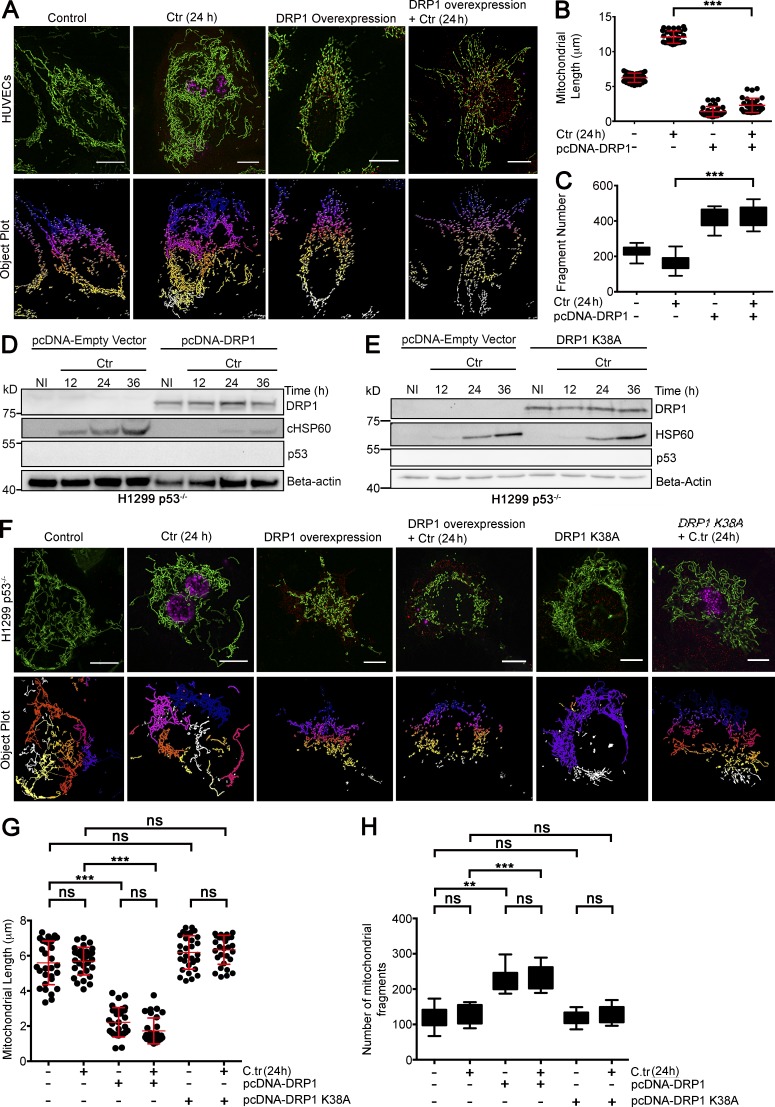
Functional Drp1 overexpression in a p53-null background fragments mitochondria and inhibits C. trachomatis infection. (A) Structured illumination micrograph of mito-HUVECs infected with C. trachomatis (C.tr) for 24 h, transfected with pcDNA-Drp1 overexpression vector, or both. Graphs represent quantification of mitochondrial length and the number of mitochondrial fragments in HUVECs upon C. trachomatis infection, overexpression of Drp1, or both. Bars, 10 µm. (B) Analysis of mitochondrial fragment length distribution in HUVECs infected with C. trachomatis and transfected with Drp1 overexpression vector. Dots represent the mean mitochondrial fragment length of ∼3 cells in a region of interest (ROI) chosen at random within samples. 30 such dots were plotted on the graph. Mean mitochondrial fragment length (μm; ± SD) in control, 6.25 ± 0.66; C. trachomatis (24 h), 12.08 ± 0.87; Drp1 overexpression, 1.39 ± 0.74; and Drp1 overexpression + C. trachomatis (24 h), 2.3 ± 1.02. (C) Analysis of mitochondrial fragment count in HUVECs infected with C. trachomatis and transfected with Drp1 overexpression vector. Mean mitochondrial fragment count (± SD) in control, 240 ± 30.08; C. trachomatis (24 h), 133 ± 44.31; Drp1 overexpression, 388 ± 51.69; and DRP1 overexpression + C. trachomatis (24 h), 399 ± 58.58 (n = 3 for B and C; ∼30 cells were analyzed from random selection of ∼10 ROI in each sample). (D and E) Immunoblots for different durations of C. trachomatis infection in control H1299 p53−/− cells and H1299 p53−/− cells transfected with pcDNA-Drp1 overexpression vector or dominant negative variant of Drp1-Drp1K38A (Smirnova et al., 2001). Blots were probed for Drp1, p53, cHSP60, and β-actin (n = 3). (F) Structured illumination micrograph of H1299 p53−/− cells expressing GFP targeted to mitochondria. Samples were transfected with pcDNA-Drp1 overexpression vector or DRP1K38A and infected with C. trachomatis for 24 h. Bars, 10 µm. (G) Graph represents quantification of the mitochondrial length distribution in H1299 p53−/− cells upon C. trachomatis infection and overexpression of Drp1 or Drp1K38A before infection. Dots represent the mean mitochondrial fragment length of ∼3 cells in an ROI chosen at random within samples. 30 such dots were plotted on the graph. Mean mitochondrial fragment length (μm; ± SD) in control, 5.59 ± 1.24; C. trachomatis, 5.69 ± 0.78; DRP1 overexpression, 2.21 ± 0.83; Drp1 overexpression + C. trachomatis (24 h), 1.72 ± 0.73; Drp1K38A overexpression, 6.18 ± 0.95; and DRP1 K38 overexpression + C. trachomatis (24 h), 6.33 ± 0.82. (H) Analysis of mitochondrial fragment count in H1299 p53−/− cells upon C. trachomatis infection, overexpression of Drp1 or DRP1K38A before infection. Mean mitochondrial fragment count (± SD) in control, 121.31 ± 27.56; C. trachomatis, 130.56 ± 25.56; DRP1 Overexpression = 225.87 ± 29.63; Drp1 overexpression + C. trachomatis (24 h), 233.43 ± 32.45; Drp1K38A overexpression, 119.12 ± 32.45; and Drp1K38A overexpression + C. trachomatis infection (24 h), 128 ± 22.96 (n = 3 for panels G and H; ∼30 cells were analyzed from random selection of ∼10 ROIs in each sample). All data represent mean ± SD. Asterisks denote significance by one-way analysis of variance followed by Tukey’s multiple comparisons test for panel C and panel D: **, P < 0.01; ***, P < 0.001; ns, nonsignificant.

