Figure 6.
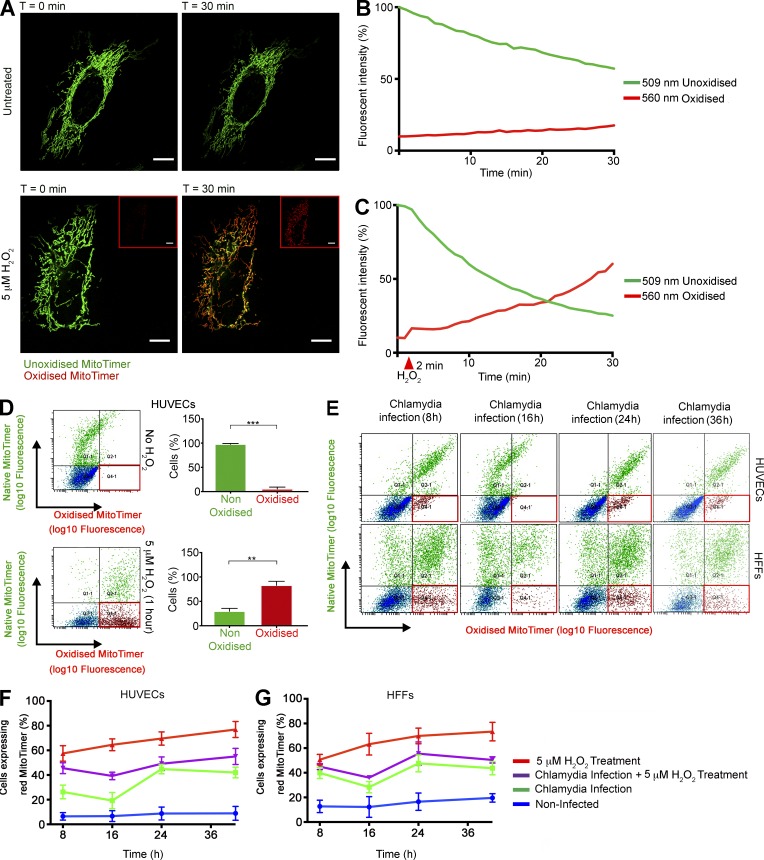
C. trachomatis infection modulates ROS production within the mitochondrial matrix. (A) Micrographs represent start (t = 0 min) and endpoints (t = 30 min) of Videos 1 and 2. pcDNA-MitoTimer was transfected into HUVECs, and the mitochondrial localization was ascertained by confocal laser scanning microscopy after 12 h. Bars, 10 µm. The samples were imaged simultaneously at 500 nm (green; native, unoxidized form) and 596 nm (red; oxidized form) to detect the fluorescence shift. 5 µM H2O2 was added into imaging media of indicated samples after 2 min of untreated imaging. Insets show the red channel images of the H2O2 -treated cells at t = 0 and 30 min. Images were captured every 60 s for 30 min. (B and C) Graphs indicate the change in fluorescent properties of the Timer protein in the absence and presence of H2O2 treatment. The arbitrary fluorescent intensity values were normalized to the starting fluorescent intensity value of the Timer protein in the green channel and depicted as percentage of that value. (D) Scatterplots indicate the change in fluorescent properties of the Timer protein in the absence and presence of H2O2 treatment as determined by FACS. Graphs indicate the percentages of cell population that exhibit fluorescence in the red channel (red box). (E) Scatter plots of MitoTimer transfected HUVEC and HFF cells after C. trachomatis (C.tr) infection for 8, 16, 24, and 36 h. A second group of cells were pretreated with 5 µM H2O2 for 30 min, washed, and infected with C. trachomatis for 8, 16, 24, and 36 h. Finally, as a control, HUVEC and HFF cells were treated with 5 µM H2O2 for 30 min, washed, and allowed to grow for 8, 16, 24, and 36 h. All samples were transfected 12 h before infection or treatment. The red box indicates the fraction of cell population expressing the red MitoTimer. (F and G) Graphs indicate the percentages of HUVEC and HFF cell populations that exhibit fluorescence in the red channel after treatments (n = 3). All data represent mean ± SD. Asterisks denote significance by Student’s t test. **, P < 0.01; ***, P < 0.001; ns, nonsignificant. See also Videos 1 and 2.

