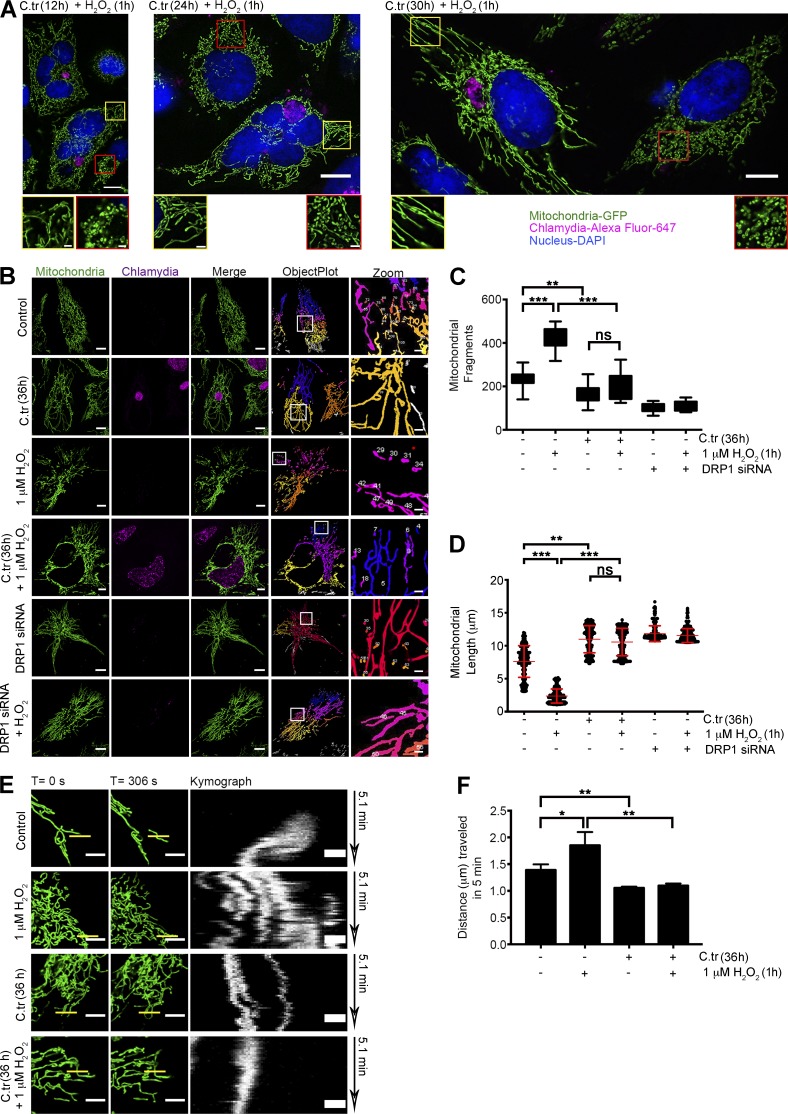
Figure 7.
C. trachomatis infection induces changes in the mitochondrial architecture by inhibiting fragmentation. (A) Structured Illumination micrographs of mito-HUVECs posttreated with 1 µM H2O2 for 1 h after 12, 24, and 30 h of C. trachomatis (C.tr) infection (C. trachomatis stained with Alexa Fluor 647 against cHSP60 and DAPI to mark the nucleus). Bar, 10 µm. Red-bordered insets focus on uninfected cells, and yellow-bordered insets focus on infected cells. Bar, 1.5 µm. (B) Micrographs represent data processing and mitochondrial segmentation by rolling ball thresholding and 3D object count. Bars, 10 µm. (C) Analysis of mitochondrial fragment length distribution in cells treated with 1 µM H2O2 and infected with C. trachomatis. Dots represent the mean mitochondrial fragment length of approximately three cells in a region of interest (ROI) chosen at random within samples. 200 such dots were plotted on the graph. Mean mitochondrial fragments length in control (± SD), 7.607 ± 2.39; H2O2, 2.36 ± 1.06; C. trachomatis, 10.98 ± 2.05; and C. trachomatis + H2O2, 9.90 ± 1.84 (n = 20; ∼30 cells were analyzed from random selection of ∼10 ROIs in each sample). (D) Comparison of fragment distribution between infected and noninfected cells. Treatment with 1 µM H2O2 is taken as positive control for fragmentation, and 36 h of siRNA-mediated Drp1 knockdown is used as negative control. Number of fragments in control (± SD), 235.4 ± 36.34; H2O2, 414.6 ± 50.39; C. trachomatis, 169.1 ± 41.12; and C. trachomatis + H2O2, 198 ± 61.52 (n = 20 for C and D; ∼30 cells were analyzed from random selection of ∼10 ROIs in each sample). (E) Freeze-frame of 20 × 20-µm sections of uninfected and C. trachomatis–infected mito-HUVECs from time-lapse video micrographs at t = 0 and 306 s (Videos 3–6). Indicated samples were treated with 1 µM H2O2. White bars represent 5 µm. Yellow bars (0.5 µm in thickness) represent arbitrary lines drawn to determine lateral displacement of mitochondrial fragments with time as represented by the Kymograph panels (unquantified). (F) Graph represents differences in mitochondrial mobility between HUVECs after 36 h of C. trachomatis infection, 1 µM H2O2 treatment for 1 h, or treatment with 1 µM H2O2 after 36 h of C. trachomatis infection. The distance moved by the mitochondrial fragments in 5 min was determined by analyzing Videos 3–6 with the mitoCRWLR macro (n = 5; three ROIs were analyzed from individual cells, with six cells being chosen at random from every sample). All data represent mean ± SD. Asterisks denote significance by one-way analysis of variance followed by Tukey’s multiple comparisons test for C and D: *, P < 0.05; **, P < 0.01; ***, P < 0.001; ns, nonsignificant. See also Video 3–6.

