Figure 8.
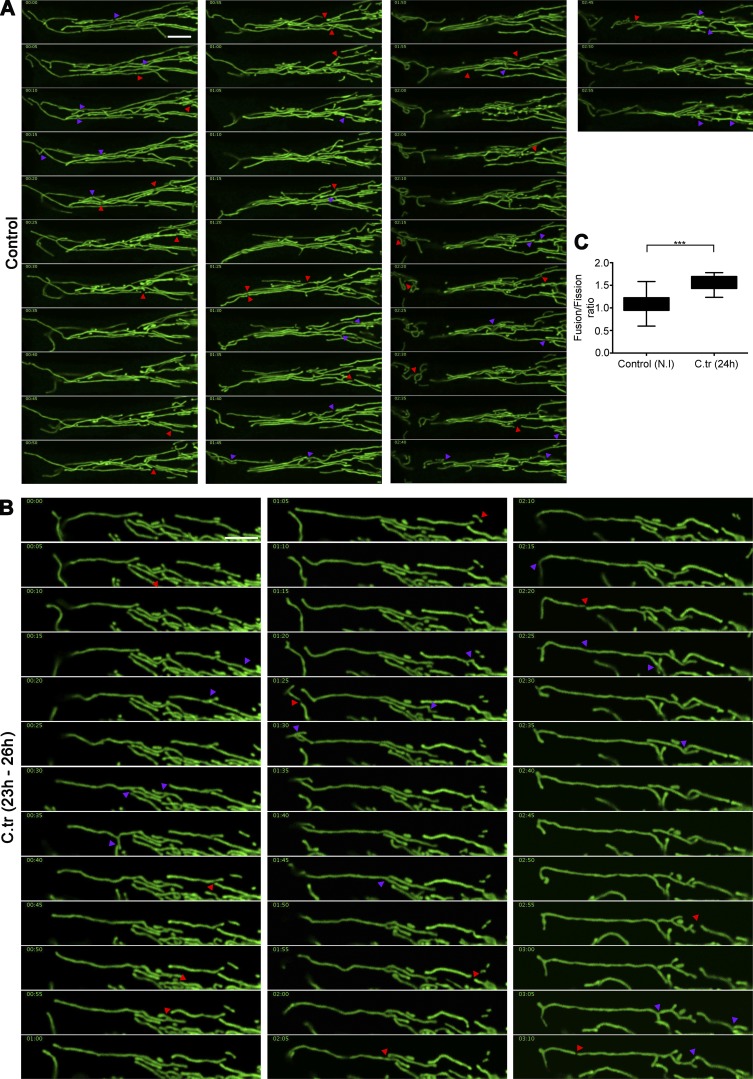
Changes in the mitochondrial fusion/fission ratio induce elongation of mitochondrial fragments in C. trachomatis–infected cells. Montage of time-lapse confocal micrography of noninfected (A) and 24-h C. trachomatis (C.tr)–infected (B) HUVEC mitochondria (Videos 7 and 8). The samples were imaged for 3 h with pictures taken every 5 min. The purple arrowheads indicate fusion events, and the red arrowheads indicate fission events. Bars, 10 µm. (C) Graph represents differences in mitochondrial fusion/fission ratio between noninfected and C. trachomatis–infected samples. Fusion/fission ratio in control (± SD), 1.09 ± 0.22; and C. trachomatis, 1.58 ± 0.17 (n = 5; two regions of interest were analyzed from individual cells, with three cells being chosen at random from every sample). Asterisks denote significance by Student’s t test. ***, P < 0.001. See also Video 7.

