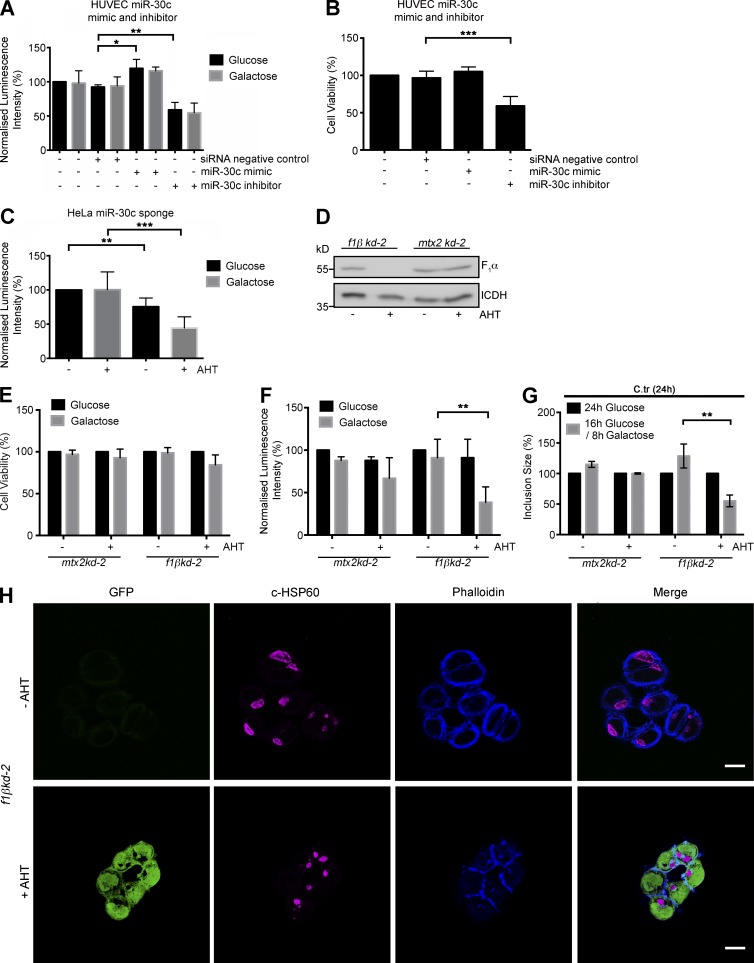
Figure 9.
C. trachomatis infection is affected by regulation of ATP synthesis in the host mitochondria. (A) Graph represents quantification of total endogenous ATP levels in HUVECs transfected with siRNA negative control miR-30c mimic and inhibitors. Indicated samples were incubated in glucose-free galactose-supplemented media and tested using a luminescent ATP detection kit according to the manufacturer’s protocol. ATP luminescence was normalized to ATP levels of untreated and nontransfected cells grown in glucose medium. (B) Cell viability measurements of HUVECs transfected with siRNA negative control, miR-30c mimic, and inhibitors and grown in glucose medium. (C) Graph represents quantification of total endogenous ATP levels in noninduced and induced HeLa-miR-30c sponge cells grown in glucose-free galactose-supplemented media. ATP luminescence was normalized to ATP levels of noninduced cells grown in glucose medium. (D) Immunoblot of isolated mitochondria from noninduced and induced (AHT) f1βkd-2 and mtx2kd-2 cells. Blots were probed with antibodies against F1α subunit, and isocitrate dehydrogenase (ICDH) was used as a loading control. (E) Cell viability measurements of noninduced and induced mtx2kd-2 and f1βkd-2 cells incubated in glucose-containing medium or for 16 h in glucose followed by 8 h in galactose-supplemented medium. (F) Graph represents ATP measurements of mtx2kd-2 and f1βkd-2 cells. The cells were incubated in glucose-containing medium or for 16 h in glucose followed by 8 h in galactose-supplemented medium. ATP luminescence was normalized to ATP levels of noninduced cells grown in glucose medium. (G) Graph represents quantification of chlamydial inclusion sizes in noninduced and induced mtx2kd-2 and f1βkd-2 cells infected with C. trachomatis for 24 h in glucose-containing medium or for 16 h in glucose followed by 8 h in galactose-supplemented medium (n = 3). (H) Representative epifluorescence micrographs of noninduced and induced f1βkd-2 cells infected with C. trachomatis for 24 h and treated as mentioned earlier and grown in glucose followed by 8 h in galactose-supplemented medium. Cells were stained against cHSP60 (magenta) and phalloidin-647 for actin (blue). GFP (green) indicates induction of shRNA. Bars, 10 µm. All data represent mean ± SD. Asterisks denote significance by Student’s t test. *, P < 0.05; **, P < 0.01; ***, P < 0.001 (n = 3 for all panels). See also Fig. S4.

