Figure 1.
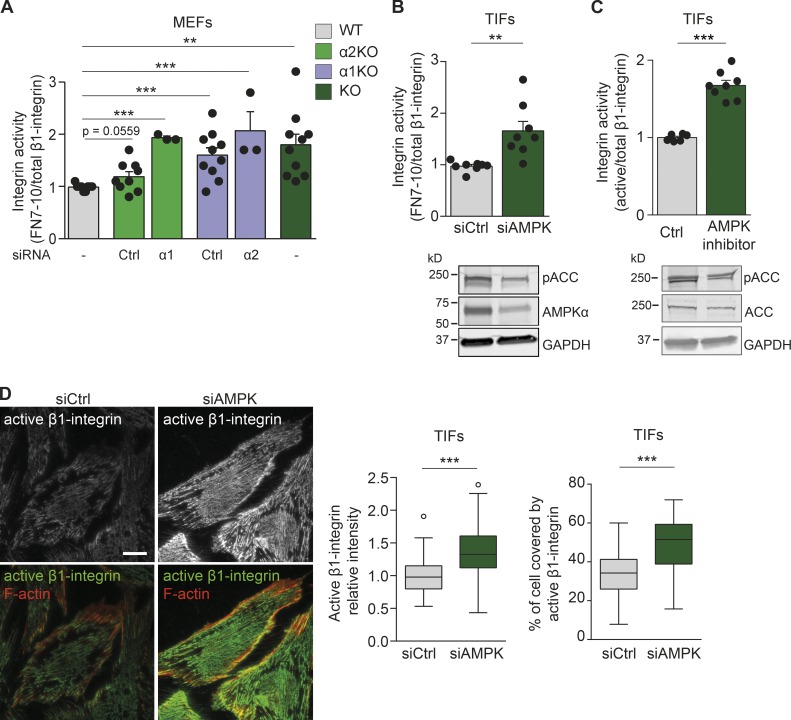
AMPK negatively regulates β1-integrin activity. (A) Quantification of flow cytometric assays of β1-integrin activity assessed as FN7–10 binding relative to total β1-integrin surface (MB1.2) levels in MEFs. Data and significance are expressed relative to WT AMPK MEFs and display means ± SEM. 10,000 cells were used per experiment. The number of independent experiments per condition (n) is represented with black dots. WT refers to MEFs expressing the catalytic AMPKα1 and AMPKα2 isoforms. α2KO and siCtrl refer to MEFs lacking the AMPKα2 catalytic subunit and silenced with control siRNA (P = 0.0559). α2KO and siα1 refer to MEFs lacking the AMPKα2 catalytic subunit and silenced for the remaining AMPKα1 subunit (***, P < 0.0001). α1KO and siCtrl refer to MEFs lacking the AMPKα1 catalytic subunit and silenced with control siRNA (***, P = 0.0009). α1KO and siα2 refer to MEFs lacking the AMPKα1 catalytic subunit and silenced for the remaining AMPKα2 subunit (***, P = 0.0002). KO refers to MEFs lacking both AMPKα catalytic isoforms (**, P = 0.0015). A two-tailed Student’s t test was used to obtain p-values. (B) Quantification of flow cytometric assays of β1-integrin activity assessed as FN7–10 binding relative to total β1-integrin (P5D2) in TIFs silenced with control siRNA (siCtrl) or with siRNAs against AMPKα1 and AMPKα2 isoforms (siAMPK). Data are expressed relative to siCtrl and represent means ± SEM. 10,000 cells were used per experiment. **, P = 0.0025 (two-tailed Student’s t test). Below are immunoblots assessing AMPKα expression and phosphorylation levels of the AMPK target ACC (pACC). GAPDH was used as a loading control. (C) Quantification of flow cytometric assays of β1-integrin activity assessed as FN7–10 binding relative to total β1-integrin (P5D2) in TIFs treated for 24 h with 10 µM dorsomorphin (AMPK inhibitor). Data are expressed relative to control and represent means ± SEM. 10,000 cells were used per experiment. ***, P < 0.0001 (two-tailed Student’s t test). Below are immunoblots assessing the phosphorylation levels of pACC and total levels of ACC. GAPDH was used as a loading control. (D) Representative TIRF microscopy images of TIFs silenced for control (siCtrl) or AMPK (siAMPK), plated on fibronectin for 7 h, and stained for active β1-integrin (12G10) and F-actin (phalloidin). The level and coverage of active β1-integrin were determined and displayed as Tukey box plots. n > 120 cells from three biological repeats. ***, P < 0.0001 (two-tailed Student’s t test). Bar, 20 µm.

