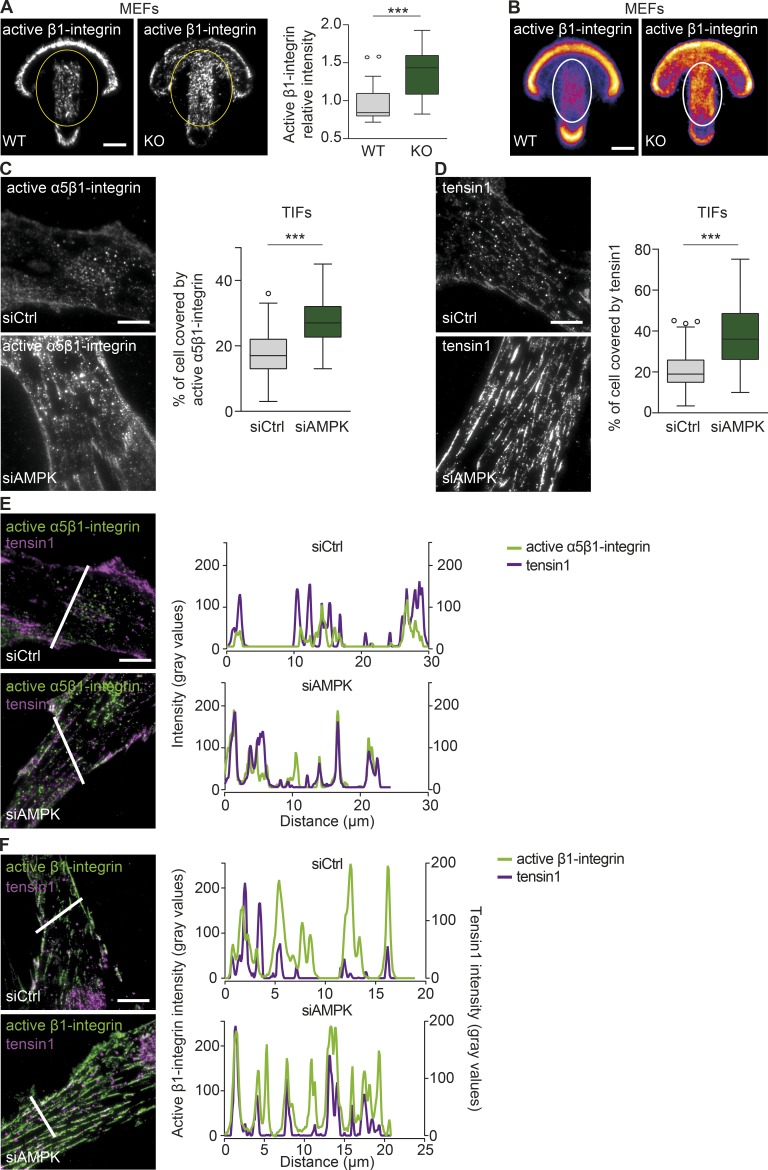
Figure 2.
AMPK depletion promotes fibrillar adhesion formation. (A and B) Representative TIRF microscopy images (A) and mean intensity maps (B) of active β1-integrin immunofluorescence (9EG7) in AMPK WT and KO MEFs plated on fibronectin-coated crossbow-shaped micropatterns. The level of active β1-integrin (blue, low level; yellow, high level) within the yellow ovals was quantified (A) and displayed as Tukey box plots. n > 25 cells from two biological repeats. The mean active β1-integrin distribution is represented with a heat map (B), wherein yellow corresponds to regions within the cell containing the largest accumulation of active β1-integrin. The white ovals indicate the centrally located adhesions. n = 20 cells. (C and D) Representative TIRF microscopy images and quantification of active α5β1-integrin (SNAKA51; C) and tensin1 (D) distribution in siCtrl and siAMPK TIFs plated on fibronectin for 7 h. Data are displayed as Tukey box plots. n > 70 cells (C) and n > 180 cells (D) from three biological repeats. (A, C, and D) ***, P < 0.0001 (two-tailed Student’s t test). (E and F) Representative TIRF microscopy images and plot profiles of siCtrl and siAMPK TIFs plated on fibronectin for 7 h and stained for either active α5β1-integrin (SNAKA51) and tensin1 (E) or for active β1-integrin (12G10) and tensin1 (F). Intensity profiles of the respective molecules were obtained across the white lines in each corresponding image. Bars, 10 µm.

