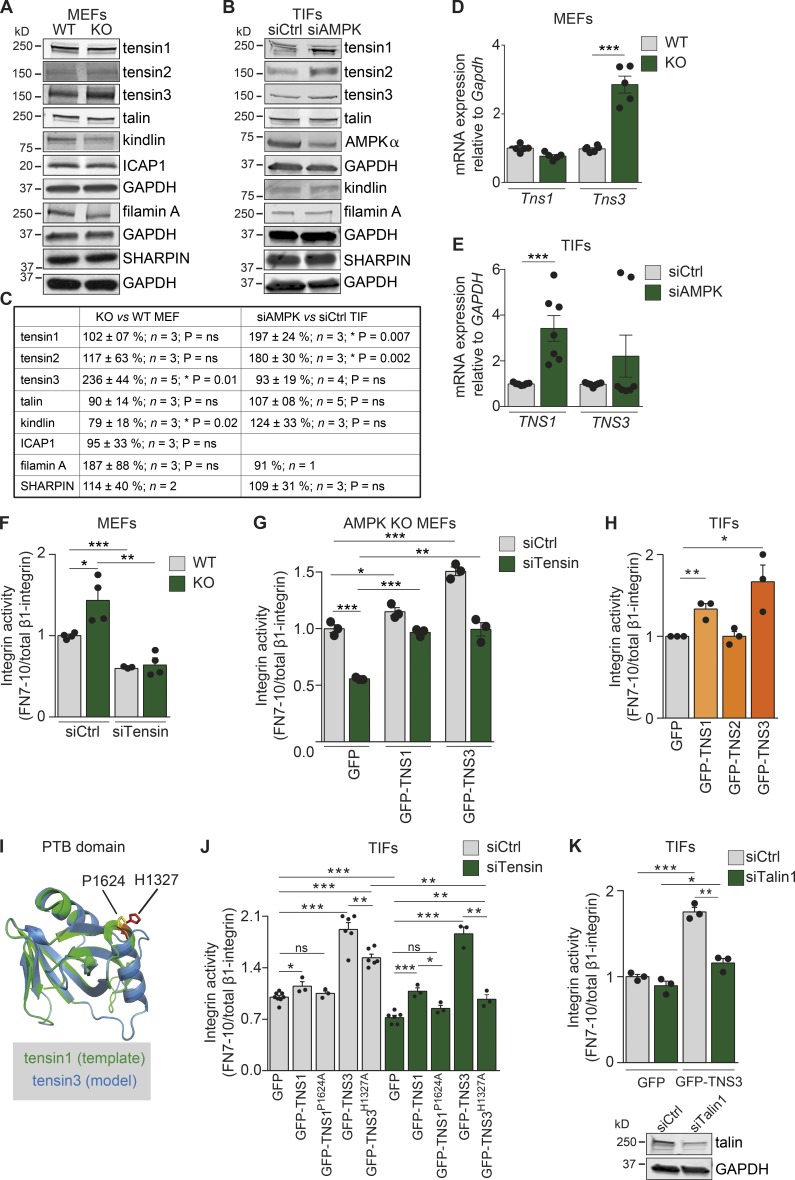
Figure 4.
Tensin regulates integrin activity downstream of AMPK. (A–C) Immunoblotting (A and B) and quantification (C) of the indicated proteins in WT and AMPK KO MEFs (A and C) and siCtrl or siAMPK TIFs (B and C). GAPDH was used as a loading control. (D and E) Quantification of mRNA levels of Tns1 and Tns3 in AMPK WT and KO MEFs relative to the housekeeping genes Gapdh, TNS1, and TNS3 in siCtrl and siAMPK TIFs relative to the housekeeping gene GAPDH (E). Data are expressed relative to WT (D) and siCtrl (E), respectively, and represent means ± SEM. ***, P < 0.0001 (two-tailed Student’s t test). (F–H) Quantification of flow cytometric assays of β1-integrin activity assessed as FN7–10 fragment binding relative to total β1-integrin in AMPK WT and KO MEFs (F), AMPK KO MEFs (G), or TIFs (H). (F) AMPK WT and KO MEFs silenced with control siRNA (siCtrl) or with siRNAs against tensin1 and tensin3 (siTensin). Data are expressed relative to WT siCtrl and represent means ± SEM. ***, P < 0.0001 for siTensin WT relative to siCtrl WT; *, P = 0.0216 for siCtrl KO relative to siCtrl WT; and **, P < 0.0029 for siTensin KO relative to siCtrl KO (two-tailed Student’s t test). (G) siCtrl or siTensin AMPK KO MEFs transiently reexpressing GFP-TNS1, GFP-TNS3, GFP alone in AMPK KO MEFs. Data are expressed relative to siCtrl-GFP–expressing cells and represent means ± SEM. ***, P = 0.0002 for siTensin-GFP relative to siCtrl-GFP; *, P = 0.0399 for siCtrl-TNS1 relative to siCtrl-GFP; ***, P = 0.0006 for siCtrl-GFP-TNS3 relative to siCtrl-GFP; ***, P < 0.0001 for siTensin-GFP-TNS1 relative to siTensin-GFP; and **, P = 0.0019 for siTensin-GFP-TNS3 relative to siTensin-GFP (two-tailed Student’s t test). (H) TIFs transiently expressing GFP, GFP-TNS1, GFP-TNS2, or GFP-TNS3. Data are expressed relative to GFP and represent means ± SEM. **, P = 0.007 for GFP-TNS1 relative to GFP; and *, P < 0.03 for GFP-TNS3 relative to GFP (two-tailed Student’s t test). (I) Alignment of the tensin1 PTB domain (1606–1738; Protein Data Bank ID: 1WVH) with the predicted structure of the tensin3 PTB domain. The critical residues for binding β1-integrin are highlighted (yellow for tensin1 and red for tensin3). The amino acids P1624 in tensin1 and H1327 in tensin3 are indicated. (J and K) Quantification of flow cytometric assays of β1-integrin activity assessed as FN7–10 fragment binding relative to total β1-integrin in TIFs. (J) siCtrl or siTensin TIFs transiently expressing GFP, GFP-TNS1, point mutant GFP-TNS1P1624A, GFP-TNS3, and point mutant GFP-TNS3H1327A. Data are expressed relative to siCtrl GFP and represent means ± SEM. For siCtrl cells, *, P = 0.02 for GFP-TNS1 relative to GFP; ***, P < 0.0001 for GFP-TNS3 relative to GFP; ***, P < 0.0001 for GFP-TNS3H1327A relative to GFP; and **, P = 0.004 for GFP-TNS3H1327A relative to GFP-TNS3. For siTensin cells, ***, P = 0.0004 for GFP-TNS1 relative to GFP; ***, P < 0.0001 for GFP-TNS3 relative to GFP; ***, P < 0.0001 for GFP-TNS3H1327A relative to GFP; and **, P = 0.004 for GFP-TNS3H1327A relative to GFP-TNS3. (K) Control or talin1-silenced (siTalin1) TIFs transiently expressing GFP or GFP-TNS3. Data are expressed relative to siCtrl GFP and represent means ± SEM. ***, P = 0.0002 for siCtrl GFP-TNS3 relative to siCtrl GFP; **, P = 0.0013 for siTalin GFP-TNS3 relative to siCtrl GFP-TNS3; *, P = 0.024 for siTalin GFP-TNS3 relative to siTalin GFP (two-tailed Student’s t test). Below are immunoblots assessing talin expression.

