Figure 5.
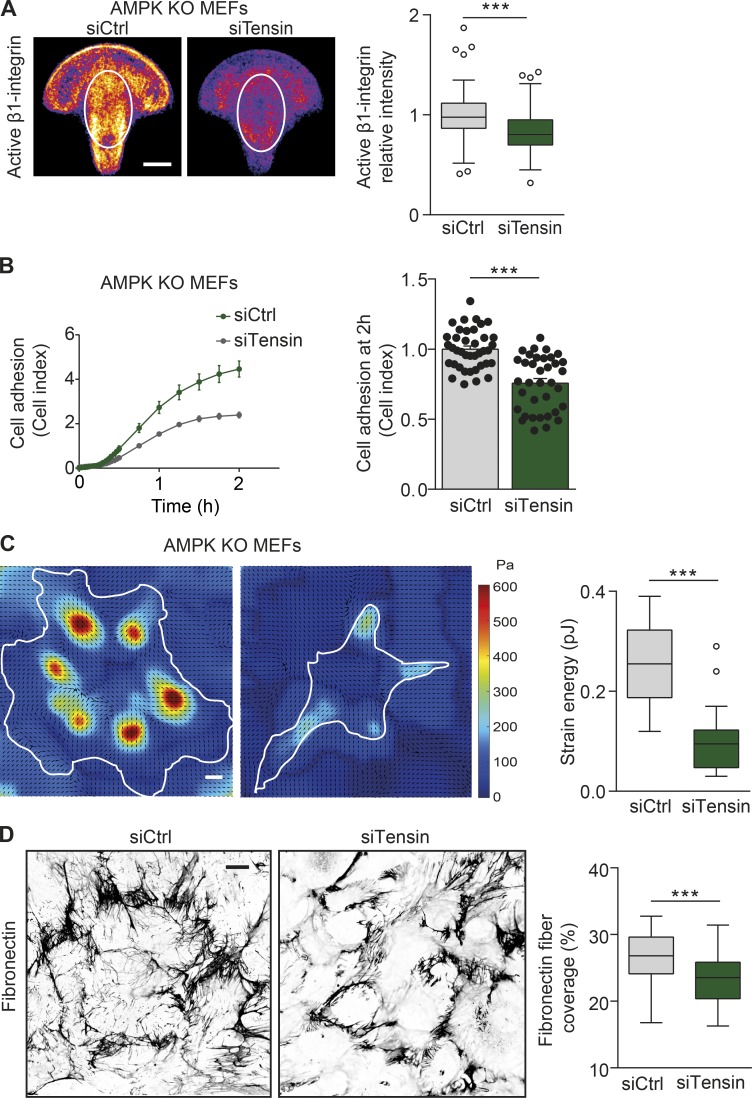
Tensin regulates cell spreading, mechanotransduction, and fibrillogenesis downstream of AMPK. (A) Representative mean intensity maps of bottom-plane images obtained with a spinning-disk confocal microscope. siCtrl or siTensin AMPK KO MEFs are stained for active β1-integrin (9EG7) and plated on fibronectin-coated crossbow-shaped micropatterns. The mean active β1-integrin distribution is represented with a heat map, wherein yellow corresponds to regions within the cell containing the largest accumulation of active β1-integrin. The white ovals indicate the centrally located adhesions, and the level of active β1-integrin within the ovals was quantified and displayed as Tukey box plots. n > 70 cells from four biological repeats. (B) Adherence of siCtrl and siTensin AMPK KO MEFs on fibronectin (1 µg/ml) as measured in real time using the xCELLigence RTCA instrument. Quantification of relative cell adhesion (cell index) at 2 h after plating is shown. Data are expressed relative to siCtrl and represent means ± SEM. n > 35 from 12 independent experiments. (C) Representative traction force maps and quantification of the mean force (strain energy, pJ) exerted by siCtrl and siTensin AMPK KO MEFs plated on fibronectin-coated (5 µg/ml) polyacrylamide gels with a Young’s modulus of ∼3 kPa. Black arrows indicate the direction of traction stress. Cell contours are denoted by white lines. The color code gives the magnitude of traction stress in Pa, which corresponds to forces of pN/µm2. Data are displayed as Tukey box plots. n = 18–19 cells from three biological repeats. (D) Representative confocal images obtained with a spinning-disk confocal microscope and quantification of the area covered by fibronectin in siCtrl and siTensin AMPK KO MEFs 16 h after supplementation with 10 µg/ml fibronectin. Data are displayed as Tukey box plots. n > 70 images from three biological repeats. (A, C, and D) Bars: (A and C) 10 µm; (D) 20 µm. (A–D) ***, P < 0.0001 (two-tailed Student’s t test).

