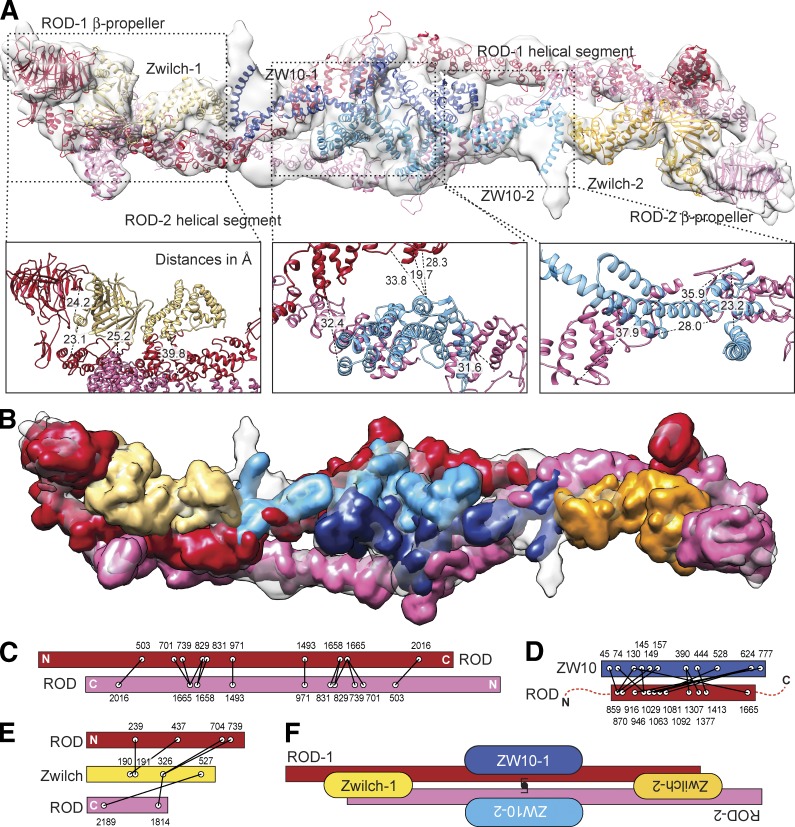
Figure 3.
A molecular model of the RZZ complex. (A) The molecular model of the RZZ, consisting of a combination of experimental (for Zwilch) or homology models (for ROD and ZW10) of RZZ subunits was fitted in the cryo-EM density. (B) Map calculated from the molecular model at a resolution of 10.4 Å. (C–E) Summary of XL-MS data reporting various classes of intersubunit cross-links (listed in Table S3). (F) Schematic view of the organization of the RZZ complex.

