Figure 5.
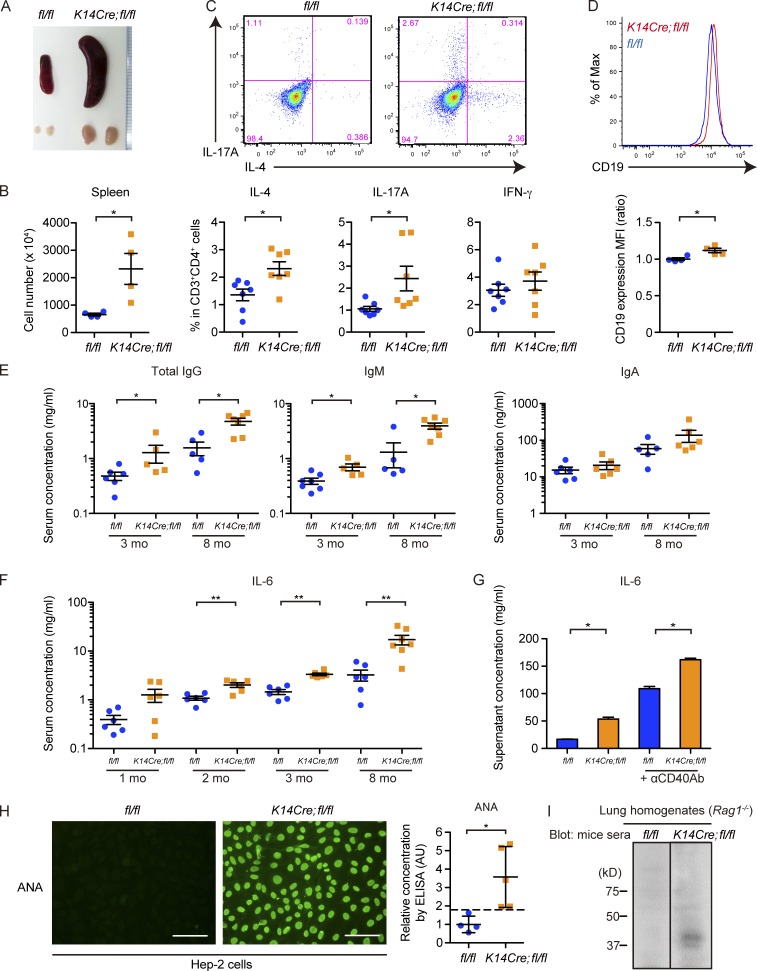
K14Cre;fl/fl mice exhibit prominent autoimmunity with Th2/Th17 cell polarization and abnormal B cell activation leading to autoantibody production. (A) A representative image of the gross appearance of spleens and inguinal lymph nodes from 3-mo-old fl/fl and K14Cre;fl/fl mice. (B) The number of splenocytes in 3-mo-old fl/fl and K14Cre;fl/fl mice was counted. n = 4 per each group. (C) Lymphocytes isolated from inguinal lymph nodes were stained for CD3 and CD4 and intracellularly stained for IL-4, IL-17A, and IFN-γ. (Top) Representative two-dimensional plots for IL-4 and IL-17A in CD3+CD4+ cells. (Bottom) The percentages of cells positive for IL-4, IL-17A, and IFN-γ are summarized. n = 7 mice per each group. (D) Splenocytes from 3-mo-old fl/fl and K14Cre;fl/fl mice were stained for B220 and CD19. B220+CD19+ cells were analyzed for CD19 expression. A representative histogram of mean fluorescence intensity (MFI; top) and the comparison of mean fluorescence intensities (bottom) are shown. n = 4 mice per genotype. (E) Sera from 3- and 8-mo-old mice were analyzed for the concentrations of total IgG, IgM, and IgA. n = 5–7 mice per genotype. Note that the results are shown with log scale. (F) Sera from 1-, 2-, 3-, and 8-mo-old mice were analyzed for the concentration of IL-6. n = 6–7 mice per genotype. (G) B cells were isolated from splenocytes of 3-mo-old mice and cultured for 48 h, either unstimulated or stimulated with anti-CD40 antibody (αCD40Ab). The culture supernatants were subject to the measurement of IL-6 concentration. n = 4 mice per each group. (H) The presence of ANA in the sera was assessed by indirect immunofluorescence with Hep-2 cells. (Left) The photographs show representative immunofluorescence images with sera from 2-mo-old mice. n = 8 mice per genotype. Bars, 100 µm. (Right) Titers of ANA in the sera were assessed with a specific ELISA. The dashed line indicates the mean + 2 SD value of fl/fl mice. n = 4–5 mice per genotype. (I) Immunoblotting of lung tissue lysates from Rag1−/− mice with sera from fl/fl and K14Cre;fl/fl mice. n = 3 mice sera per group. For photographs, immunofluorescence, and immunoblotting, representative results are shown. Data are shown as mean ± SEM. *, P < 0.05; **, P < 0.01; by two-tailed Mann-Whitney U test. The results are from representative experiments that have been repeated three times in different pairs of mice. AU, arbitrary units; MFI, mean fluorescence intensity.

