Figure 6.
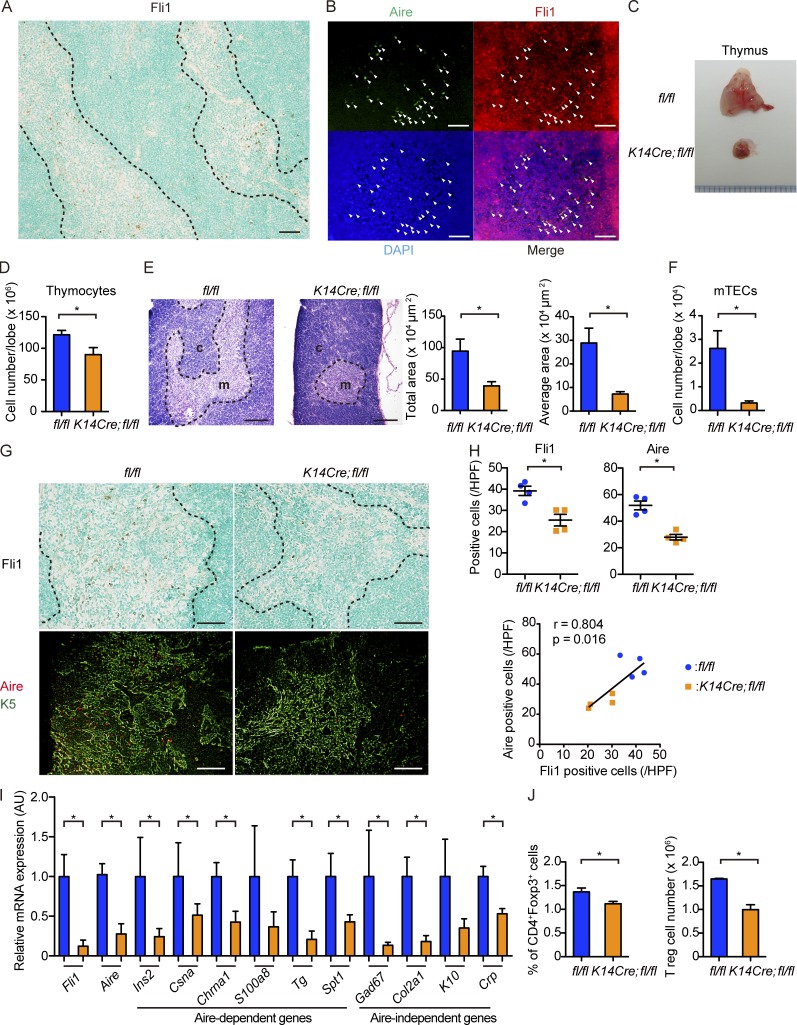
mTECs robustly express Fli1, and K14Cre;fl/fl mice show thymic hypotrophy with decreased Aire expression. (A and B) Immunohistochemistry for Fli1 (A) and double immunofluorescence for Aire and Fli1 (B) were performed with thymuses of 1-mo-old wild-type (C57BL/6) mice. In immunofluorescence, Aire, Fli1, and nuclei were stained with fluorescein isothiocyanate (green), Alexa Flour 555 (red), and DAPI (blue), respectively. Arrowheads indicate Aire-positive mTECs expressing Fli1. n = 5 mice. Bars, 50 µm. (C) Gross appearance of thymuses from 2-mo-old fl/fl and K14Cre;fl/fl mice. (D) The number of thymocytes was counted per lobe. n = 4 mice per genotype. (E) H&E staining of thymuses from 2-mo-old fl/fl and K14Cre;fl/fl mice. c, cortex; m, medulla. (Right) The total area of the medulla and the mean area per islet in each group. n = 4 per each group of mice. Bars, 200 µm. (F) Thymuses from 2-mo-old mice were subjected to flow cytometric analysis. The number of mTECs, defined as CD45−EpCAM+Ly51− cells, was calculated per lobe. n = 4 per group of mice. (G) Immunohistochemistry for Fli1 and double immunofluorescence for Aire and K5 with thymuses from 8-wk-old mice. K5-positive areas indicate the thymic medulla. Bars, 50 µm. (H, top) Fli1- and Aire-positive cells per HPF were counted. (Bottom) The correlation between the numbers of Aire- and Fli1-positive cells was assessed by Spearman’s correlation analysis. The solid line represents the regression line. n = 4 per group. (I) mRNA expression analysis for Fli1, Aire, and representative Aire-dependent and Aire-independent genes in the sorted mTECs defined as CD45−EpCAM+Ly51− cells. n = 4 per group. AU, arbitrary units. (J) Analysis on thymic T reg cells. Gates were set serially on singlets, and CD3+ and CD4+Foxp3+ cells were analyzed. The proportion of CD4+Foxp3+ cells in CD3+ cells (left) and the number of these cells (right) are shown. n = 4 mice per group. (A, E, and G) Dashed lines indicate the border between medulla and cortex. For immunofluorescence, immunohistochemistry, and H&E staining, representative images of five independent experiments are shown. Results of other experiments are from representative experiments that have been repeated three times in different pairs of mice yielding similar results. Data are shown as mean ± SEM. *, P < 0.05 by two-tailed Mann-Whitney U test.

