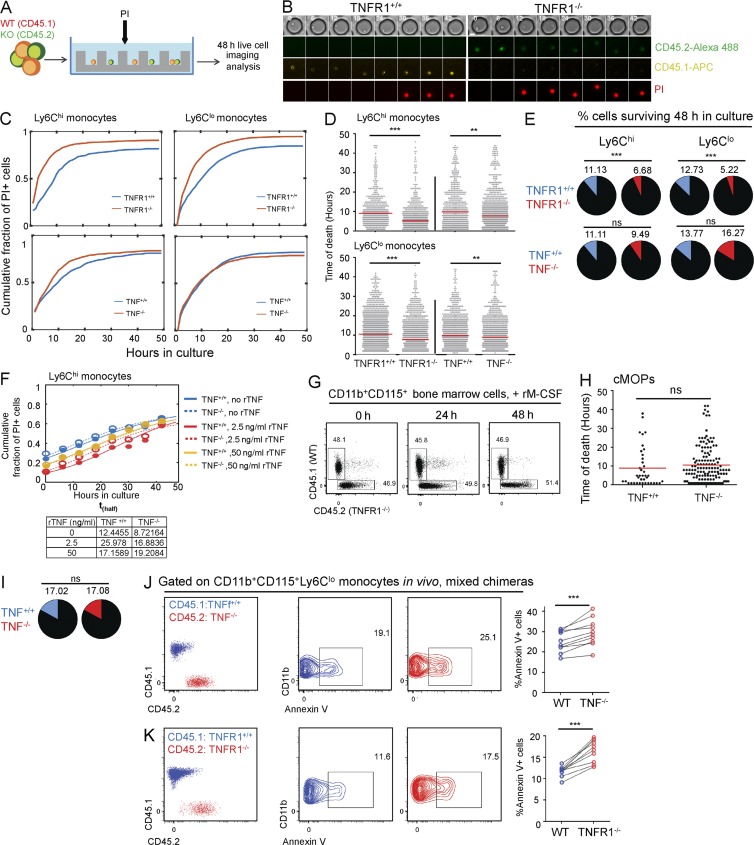
Figure 2.
Absence of TNF signaling increases apoptosis of circulating monocytes. (A) Scheme of in vitro co-culturing of TNF/TNFR1-deficient and WT monocytes in microwells. (B) Traces of co-cultured WT (TNFR1+/+) and TNFR1−/− monocytes monitored in culture for 48 h. WT/TNFR1−/− cells were distinguished by fluorescently labeled antibodies against CD45.1/CD45.2, respectively. Cell death time was monitored using PI. Bar, 10 μm. (C and D) Cumulative fraction of dead monocytes (PI+) during 48 h (C) and timing of PI signal (indicating time of cell death) for individual cells (D) in co-cultures of: Ly6Chi WT/TNFR1−/− monocytes (n = 567 and 960 cells, respectively), Ly6Chi WT/TNF−/− (n = 641 and 1,348), Ly6Clo WT/TNFR1−/− (n = 1,567 and 1,766), and Ly6Clo WT/TNF−/− (n = 1,121 and 1,162). Red lines in D show means. **, P < 0.01; ***, P < 0.001. Mann-Whitney U test was used. (E) Fraction of monocytes surviving after 48 h of co-culture. ***, P < 0.001. χ2 test was used. (F) Cumulative fraction of dead (PI+) Ly6Chi WT/TNF−/− monocytes co-cultured in microwell arrays during 48 h without TNF (n = 80 and 164) or with 2.5 ng/ml (n = 192 and 142) or 50 ng/ml (n = 112 and 181) recombinant TNF (rTNF). Closed and open circles show data (WT and TNF−/−, respectively), and continuous and dashed lines represent the best-fit logistic curve (see Materials and methods). The table shows thalf, the time by which the curves reach half of their maximum value. (G) FACS analysis of mixed cultures of MACS-sorted CD115+CD11b+ BM cells of CD45.1 and CD45.1/CD45.2 TNFR1−/− mice in the presence of 10 ng/ml M-CSF. Data are representative of three biological repeats. rM-CSF, recombinant M-CSF. (H and I) Timing of PI signal for individual cells (H) and fraction of cells surviving after 48 h (I) of cMOPs sorted from BM of WT and TNF−/− mice, co-cultured in microwell arrays. n = 47 and 170. (J and K) Fraction of annexin V+ Ly6Clo monocytes in BM chimeric [TNF/WT > WT] (F) and [TNFR1−/−/WT > WT] (G). n = 9–10. ***, P < 0.001. Paired Student’s t test was used.

