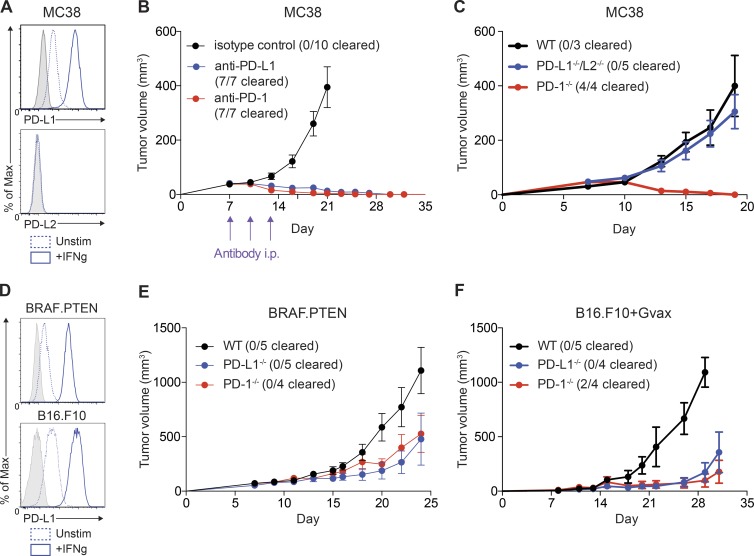
Figure 1.
Relative role of PD-L1 on tumor cells differs by model. (A) MC38 tumor cells were cultured in vitro and stimulated with IFN-γ (20 ng/ml) for 24 h. Expression of PD-L1 and PD-L2 was assessed by flow cytometry. FMO staining control shown in gray. (B) WT mice were given 105 MC38 tumor cells s.c. and treated on days 7, 10, and 13 with (red) anti–PD-1 (29F.1A12; 29/30 mice cleared tumors across all experiments) or (black) isotype control (rIgG2a; n = 5), or (blue) anti–PD-1 (339.6A2; 20/30 mice cleared tumors across all experiments) or isotype control (mIgG1; n = 5). Tumors were measured every 2–3 d starting on day 7. Control treated tumors had equivalent growth curves and were pooled for plotting purposes. Tumor growth is representative of five independent experiments with at least five mice per group. (C) WT, PD-1−/−, or PD-L1−/−/L2−/− mice were given 105 MC38 tumor cells s.c. Tumors were measured every 2–3 d starting on day 7. Tumor growth is representative of five independent experiments with at least five mice per group. (D) BRAF.PTEN melanoma cells and B16.F10 melanoma cells were cultured in vitro and stimulated with IFN-γ (20 ng/ml) for 24 h. Expression of PD-L1 was assessed by flow cytometry. FMO staining control is shown in gray. Expression representative of three independent experiments where n = 3. (E) WT, PD-1−/−, or PD-L1−/−/L2−/− mice were given 105 BRAF.PTEN tumor cells s.c. Tumors were measured every 2–3 d starting on day 7. Tumor growth is representative of three independent experiments with at least five mice per group. (F) WT, PD-1−/−, or PD-L1−/−/L2−/− mice were given 105 B16.F10 tumor cells s.c. and 106 irradiated B16/GM-CSF tumor cells s.c. on the contralateral side. Tumors were measured every 2–3 d starting on day 7. Tumor growth is representative of three independent experiments with at least five mice per group.

