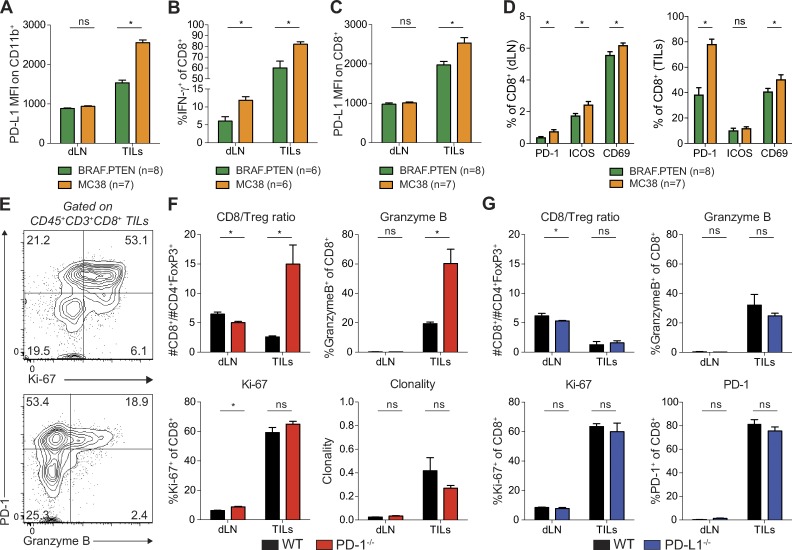
Figure 2.
PD-L1 on MC38 tumor cells directly suppresses CD8 TILs. (A–D) Cells were isolated from the draining LN (dLN) or tumor (tumor infiltrating leukocytes; TILs) on day 20 of MC38 or BRAF.PTEN tumor growth and analyzed by flow cytometry. Analysis representative of two independent with at least six mice per group as indicated under each plot. Statistical significance determined by Student’s t test where P < 0.05 (* indicates significance; ns, not significant). (A) Expression of PD-L1 on CD45+CD11b+ myeloid cells analyzed directly ex vivo. (B) Expression of IFN-γ in CD8+ T cells after ex vivo restimulation. Gating is based on unstimulated control. (C) Expression of PD-L1 on CD8+ T cells analyzed directly ex vivo. (D) Expression of PD-1, ICOS, and CD69 on CD8+ T cells analyzed directly ex vivo. (E) CD45+CD3+CD8+ live cells were isolated from the tumor of WT mice on day 10 of tumor growth and analyzed by flow cytometry directly ex vivo. Representative plots showing expression of PD-1, and Granzyme B or Ki-67 on TILs from WT mice where the numbers within each quadrant represent the frequency of each population. (F and G) Cells were isolated from the dLN or tumor (tumor infiltrating lymphocytes; TILs) on day 10 of tumor growth and analyzed by flow cytometry directly ex vivo. Statistical significance determined by Student’s t test, where P < 0.05 (* indicates significance; ns, not significant). (F) TIL analyses from WT and PD-1−/− mice. The ratio of CD8+ T cells to CD4+FoxP3+ cells (CD8/T reg), percentage of cells expressing Ki-67 or Granzyme B, and the clonality of CD8+ T cells were compared in tumors from WT and PD-1−/− mice. (G) TIL analyses from WT and PD-L1−/− mice. The ratio of CD8+ T cells to CD4+FoxP3+ cells (CD8/T reg), percentage of cells expressing Ki-67, PD-1, or Granzyme B were compared in tumors from WT and PD-L1−/− mice. Clonality calculation is from one experiment.

