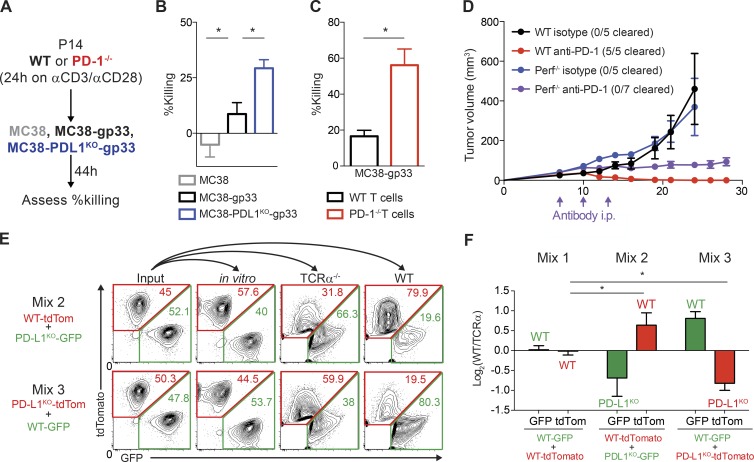
Figure 4.
PD-L1 on MC38 tumor cells directly suppresses cytotoxicity of CD8+ T cells. (A) Experimental schema for B and C. P14 TCR Tg T cells were isolated and stimulated with anti-CD3/CD28 for 24 h, and then cultured with the indicated MC38 cells for 44 h. Tumor cell killing represents percentage reduction in number of tumor cells with T cells relative to control cultures without T cells. All experiments were performed with four biological replicates per group and are representative of at least two independent experiments. (B) Relative killing by WT T cells of MC38 control cells, MC38 cells expressing the gp33 antigen (MC38-gp33), and MC38-gp33 cells deficient for PD-L1. Statistical significance determined by Student’s t test where P < 0.05 (* indicates significance). (C) Relative killing of MC38-gp33 by WT versus PD-1–deficient T cells. Statistical significance determined by Student’s t test where P < 0.05 (* indicates significance). (D) WT or Perforin−/− mice were given 105 MC38 tumor cells s.c. and treated on days 7, 10, and 13 with anti–PD-1 (339.6A2) or isotype control (mIgG1). Tumors were measured every 2–3 d starting on day 7. Tumor growth is representative of two independent experiments with at least five mice per group. (E and F) Control MC38 and MC38 PD-L1KO tumor cells that stably express GFP or tdTomato were mixed at a 1:1 ratio (input) and either cultured in vitro for 15 d or 105 total cells administered s.c. to TCRα−/− mice or WT mice. Tumor cell composition was analyzed 20 d later. (E) Representative plots were gated on live CD45− fluorescent cells where the numbers within the red and green gates represent the frequency of TdTomato or GFP+ cells, respectively, of live CD45− fluorescent cells. (F) Ratio of frequency of GFP+ and tdTomato+ tumor cells from WT mice and TCRα−/− (Log2(WT/TCRα) mice after 15 d of growth in vivo representative of three independent experiments (n ≥ 4 mice per group). Statistical significance was determined by Student’s t test, where P < 0.05.

