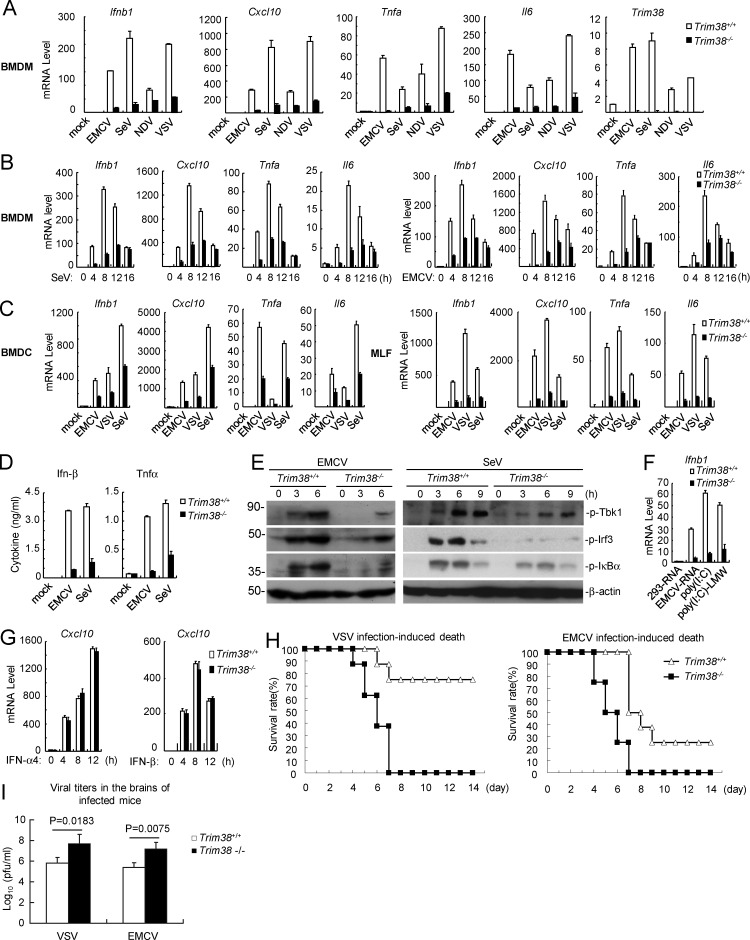
Figure 2.
TRIM38 is required for RLR-mediated innate immune response. (A and B) Effects of Trim38 deficiency on RNA virus–induced transcription of downstream antiviral genes in BMDMs. The indicated cells were left uninfected or infected with the indicated viruses for 6 h (A) or infected with SeV or EMCV for the indicated times (B) before qPCR analysis. (C) Effects of Trim38 deficiency on RNA virus–induced transcription of downstream antiviral genes in BMDCs or MLFs. Trim38+/+ and Trim38−/− BMDCs (A) or MLFs (B) were left uninfected or infected with EMCV, VSV, or SeV for 6 h before qPCR analysis. (D) Effects of Trim38 deficiency on EMCV- and SeV-induced secretion of Ifn-β and Tnfα cytokines in BMDMs. The indicated cells were left uninfected or infected with EMCV or SeV for 18 h before ELISA with the culture medium. (E) Effects of Trim38 deficiency on EMCV- or SeV-induced phosphorylation of Tbk1, Irf3, and IκBα in BMDMs. The indicated cells were left uninfected or infected with EMCV or SeV for the indicated times, followed by immunoblotting analysis. (F) Effects of Trim38 deficiency on transcription of antiviral genes induced by transfected nucleic acids in MLFs. The indicated cells were transfected with the indicated nucleic acids for 6 h before qPCR analysis. (G) Effects of Trim38 deficiency on IFN-α4- or IFN-β–induced transcription of Cxcl10 in BMDMs. The indicated cells were left untreated or treated with IFN-α4 or IFN-β for the indicated times for the indicated times before qPCR analysis. (H) Effects of Trim38 deficiency on VSV- or EMCV-induced death of mice. Trim38+/+ and Trim38−/− mice (n = 16) were intranasally infected with VSV at 108 PFU per mouse or EMCV at 105 PFU per mouse, and the survival rates of mice were observed and recorded for two weeks. (I) Measurement of viral titers in the brain of infected mice. Trim38+/+ and Trim38−/− mice (n = 3) were intranasally infected with VSV at 108 PFU per mouse or EMCV at 105 PFU per mouse. 2 d later, the brains of the infected mice were extracted for measurement of viral titers. The P-values were calculated using the Student’s t test. Data in A, B, and C are from four biological replicates. Data in F and G are from one representative experiment with three technical replicates. The error bars are mean ± SD in A–D, F, G, and I. Experiments were repeated twice (E–I) or three times (D).

