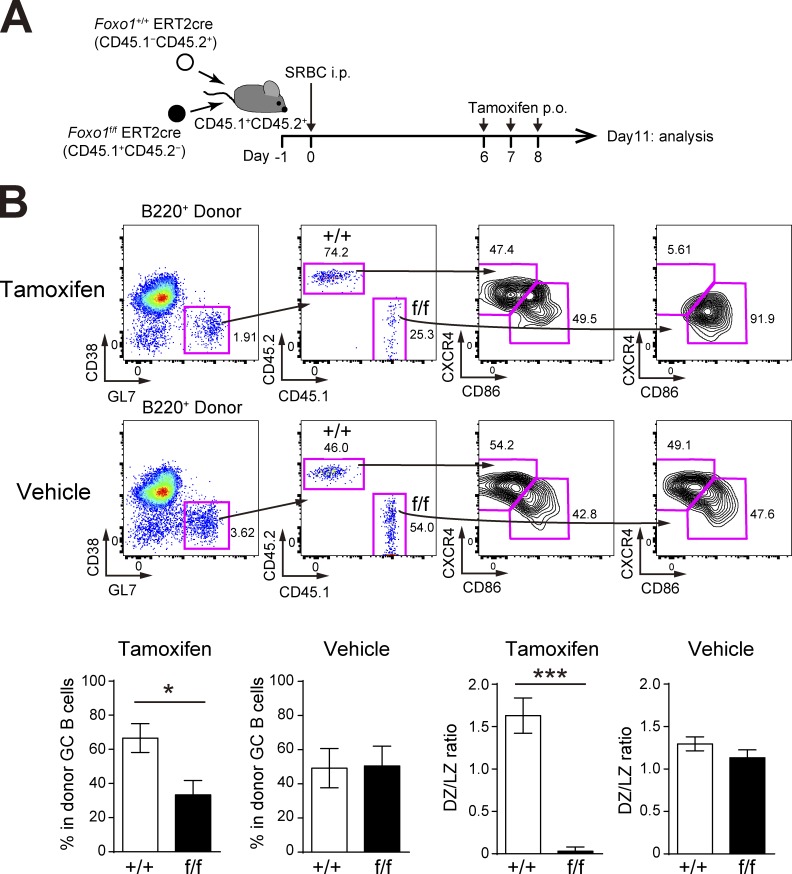
Figure 4.
GC phenotype with Foxo1 ablation during a polyclonal immune response. (A) Schematic representation of the experimental protocol. Because entering the GC in the polyclonal stimulation was a little earlier than the monoclonal condition (Fig. 2 A), we treated mice with tamoxifen on day 6, 7, and 8, and analyzed on day 11. (B, top) Flow cytometry of donor B cells (B220+CD45.1−CD45.2+ and B220+CD45.1+CD45.2−). (bottom left) Percentage of each donor in total donor GC B cells (CD45.1−CD45.2+ or CD45.1+CD45.2−B220+GL7+CD38−). (bottom right) Ratio of DZ:LZ cells. n = 5 biological replicates. Error bars represent SD. *, P < 0.05; ***, P < 0.001; paired Student’s t test. Data are representative of two independent experiments.

