Figure 5.
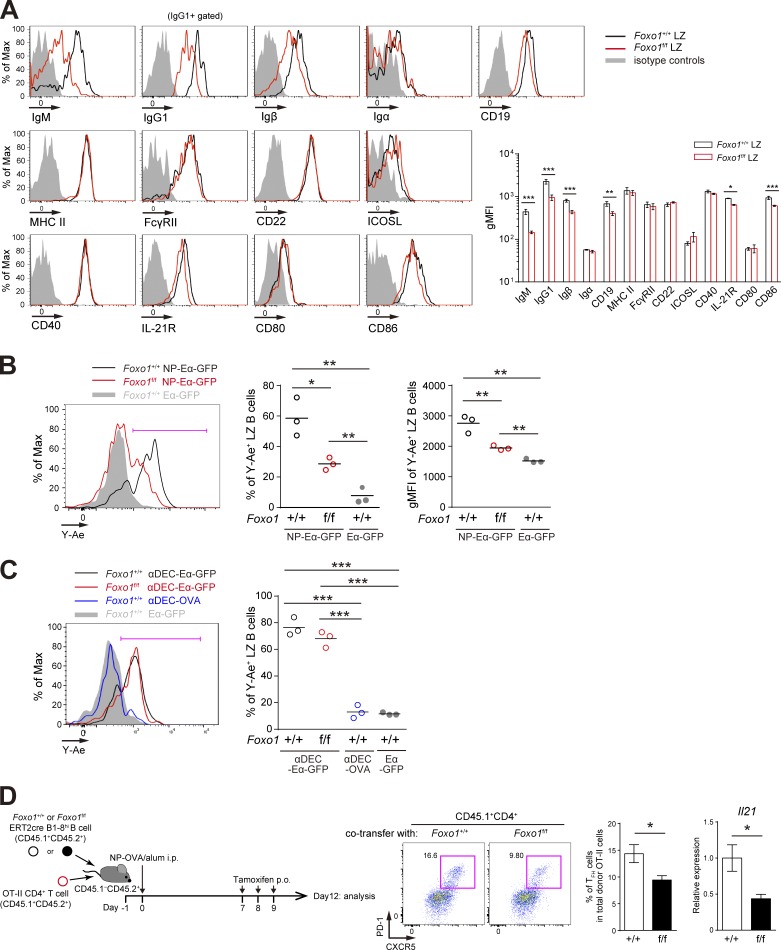
Decreased antigen presentation of Foxo1-deficient LZ GC B cells. (A, left) Flow cytometry of surface molecules on Foxo1+/+ and Foxo1f/f LZ GC B cells. Mice were immunized as described in Fig. 2 A, and LZ GC B cells were prepared on day 12. (right) Histograms indicating the gMFI of each population. n = 3 biological replicates. (B) In vitro antigen presentation assay. Mice were prepared as described in Fig. 3 A. Purified splenic B cells were incubated with NP-Eα-GFP or Eα-GFP for 1 h at 37°C. Antigen-presenting LZ GC B cells were detected by staining the LZ GC B cells (CD45.1+CD138−GL7+CD38−CD86hiCXCR4lo) with Y-Ae antibody. (left) Flow cytometry of LZ GC B cells; (middle) the percentage of Y-Ae+ (bracketed line in the left) LZ GC B cells; (right) the gMFI of Y-Ae of Y-Ae+ LZ GC B cells. n = 3 biological replicates. (C) In vitro antigen presentation of Foxo1-deficient LZ GC B cells using αDEC-Eα-GFP. Eα-GFP and αDEC-OVA were used as negative controls. Mice were prepared as described in Fig. 3 A. (left) Flow cytometry of LZ GC B cells; (right) the percentage of Y-Ae+ (bracketed line in the left) LZ GC B cells. n = 3 biological replicates. (D) Effects of Foxo1 ablation in LZ GC B cells on TFH cell number and cytokine production. (left) Schematic representation of the experimental protocol. Foxo1+/+ ERT2cre B1-8hi CD45.1+CD45.2+ or Foxo1f/f ERT2cre B1-8hi CD45.1+CD45.2+ B cells were co-transferred together with CD4+ T cells from OT-II CD45.1+CD45.2+ mice into wild-type mice (CD45.1−CD45.2+), which were immunized with NP-OVA/alum i.p. on day 0. Mice were administered tamoxifen p.o. on day 7, 8, and 9, and analyzed on day 12. (middle) Flow cytometry of OT-II CD4+ T cells (CD45.1+CD4+). (right) The percentage of TFH cells (CD45.1+CD4+CXCR5+PD-1+) among total donor OT-II cells, and the quantification of Il21 mRNA expression in sorted TFH cells by real-time qPCR. n = 8 biological replicates. Error bars represent SD. Data are representative of three (A) or two (B–D) independent experiments. *, P < 0.05; **, P < 0.01; ***, P < 0.001; unpaired Student’s t test.

