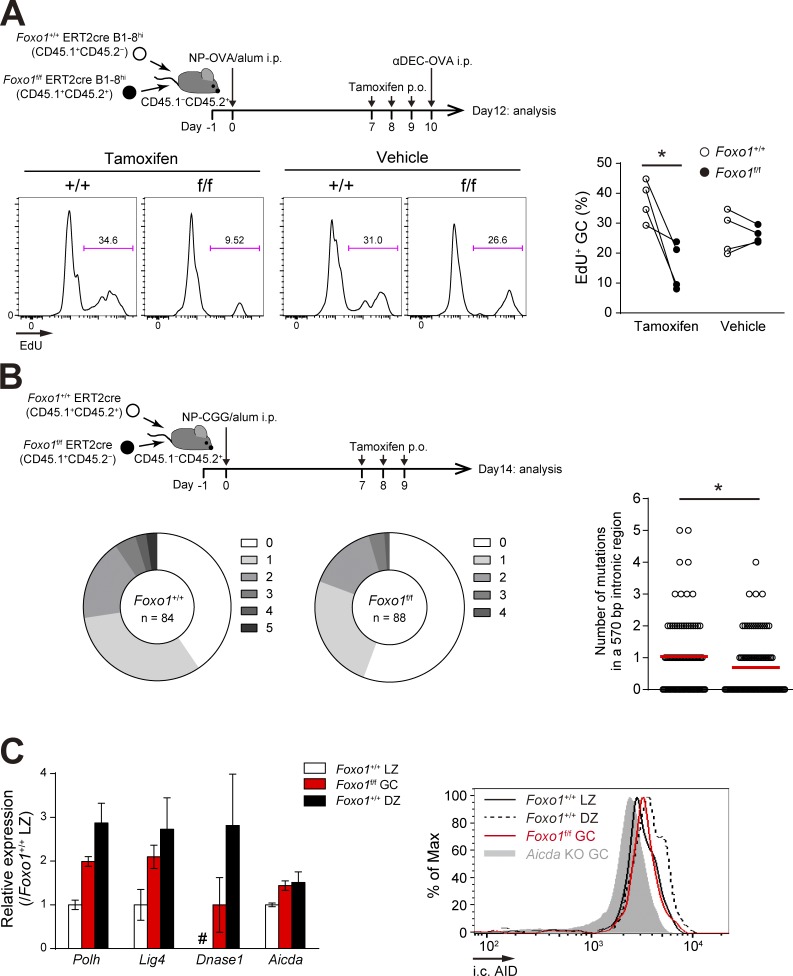
Figure 6.
Foxo1-deficient GC B cells have defects in proliferation and SHM. (A, top) Schematic representation of the experimental protocol. Mice were injected i.p. with αDEC-OVA on day 10 and analyzed on day 12. Bottom, proliferation status of Foxo1+/+ and Foxo1f/f GC B cells assessed by EdU incorporation 30 min after an EdU injection. n = 4 biological replicates. (B) JH4 intron SHM analysis in control and Foxo1-deficient LZ GC B cells. (top) Schematic representation of the experimental protocol. Bottom left, the pie charts showing the relative frequency of sequences with 0–5 mutations from mice of each genotype. n = number of sequences analyzed. (bottom right) Mutation frequencies (number of mutations in a JH4 570 bp intronic region). Red bars indicate the mean. (C, left) Expression of selected SHM-related genes in Foxo1+/+ LZ, Foxo1f/f GC, and Foxo1+/+ DZ B cells based on RNA-seq analysis. Relative fragments per kilobase of exon per million reads (FPKM) values normalized with Foxo1+/+ LZ cells are shown. For Dnase1, the FPKM value of Foxo1f/f GC B cells was set as 1. #, undetected. n = 3 biological replicates. (right) Flow cytometry of intracellular AID protein expression in Foxo1+/+ LZ, Foxo1f/f GC, and Foxo1+/+ DZ GC B cells. Gray histogram, control signal in Aicda KO GC B cells, which were prepared from immunized Aicdaf/f ERT2cre mice treated with tamoxifen. Error bars represent SD. Data are representative of two independent experiments (A and C, right), pooled from two independent animals (B), and from one experiment with three biological replicates (C, left). *, P < 0.05; paired Student’s t test (A) and Mann-Whitney test (B).

