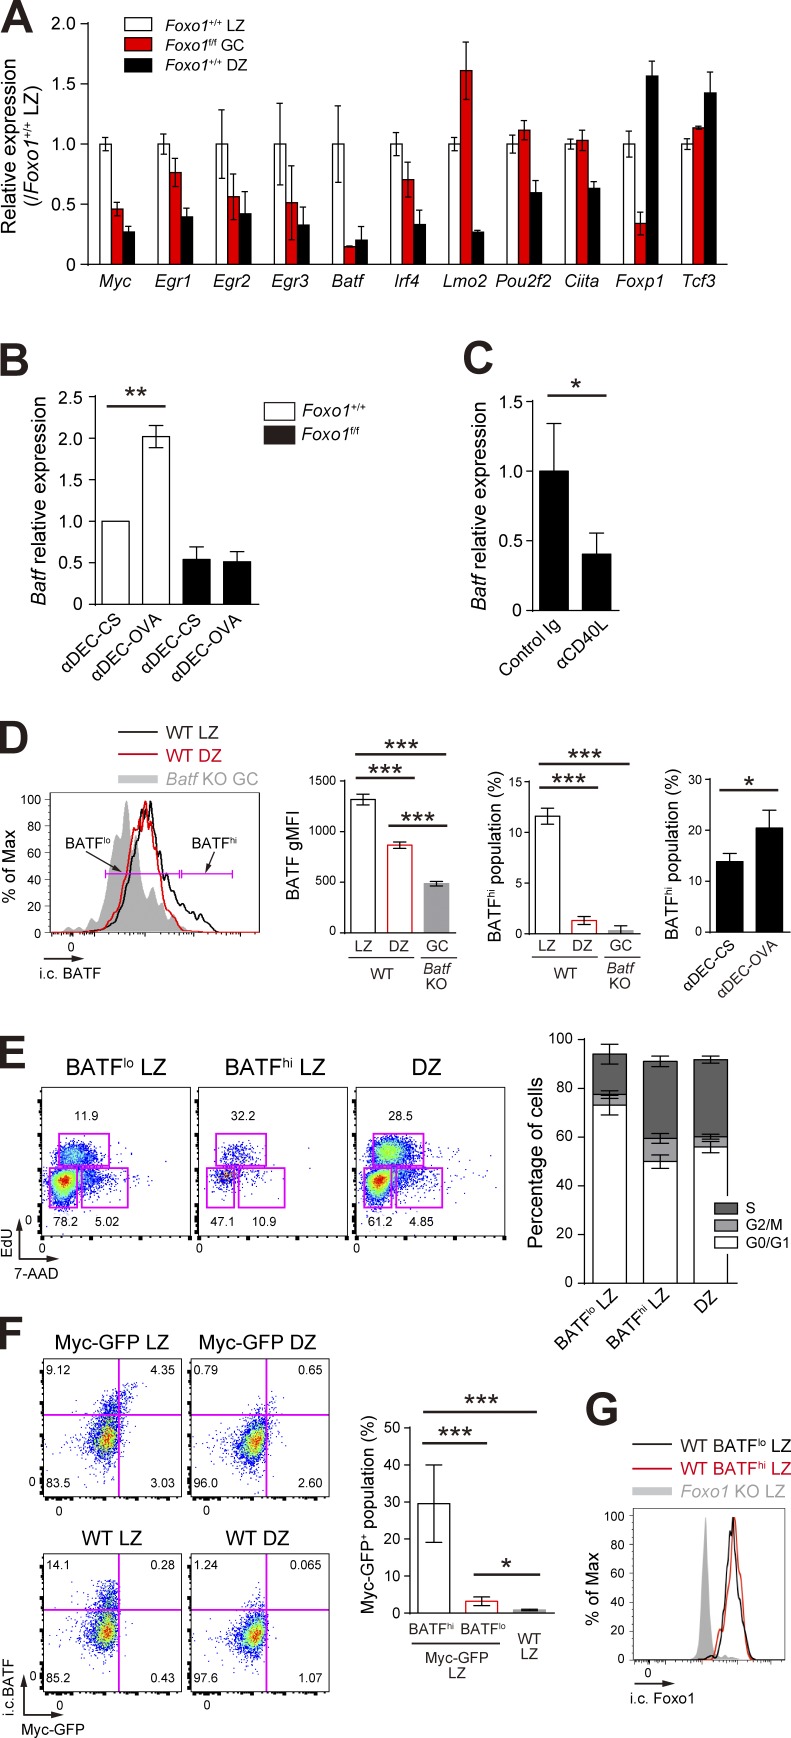
Figure 7.
T cell help triggers BATF expression in a Foxo1-dependent manner. (A) Expression of selected transcription factors in Foxo1+/+ LZ, Foxo1f/f GC, and Foxo1+/+ DZ B cells based on RNA-seq analysis. Relative FPKM values normalized with Foxo1+/+ LZ cells are shown. (B) Real-time qPCR analysis of Batf mRNA in control and Foxo1-deficient LZ GC B cells after injection of anti–DEC-OVA. Data were normalized with control cells treated with anti–DEC-CS. n = 3 biological replicates. (C) Real-time qPCR analysis of Batf mRNA in wild-type LZ GC B cells after injection of anti-CD40L. n = 4 biological replicates. (D, left) Flow cytometry of intracellular BATF protein expression in LZ and DZ GC B cells. Gray histogram, control signal in Batf KO cells prepared as described in Fig. 8 A. Bracketed lines indicate the BATFlo and BATFhi populations. (middle left) BATF gMFI of each population. n = 3 biological replicates. (middle right) Percentage of BATFhi population. n = 3 biological replicates. (right) Percentage of BATFhi population in the LZ B cells. B1-8hi CD45.1+ B cells were transferred into wild-type mice (CD45.1−CD45.2+), which were immunized with NP-OVA/alum i.p. on day 0. Mice were injected i.p. with anti–DEC-OVA or anti–DEC-CS on day 10. CD45.1+B220+NP+ LZ B cells were analyzed 24 h after injection of each antibody. n = 3 biological replicates. (E, left) Cell cycle analysis of BATFlo LZ, BATFhi LZ, and DZ GC B cells. (right) The percentage of GC B cells at different stages of the cell cycle. S, EdU+ 7-AADint; G2/M, EdU− 7-AADhi; G0/G1, EdU− 7-AADlo. Wild-type mice were immunized with NP-CGG/alum i.p., followed by injection of EdU on day 10, 30 min before analysis of the LZ (B220+GL7+CD38−CD86hiCXCR4lo), and DZ (B220+GL7+CD38−CD86loCXCR4hi) GC B cells. n = 5 biological replicates. (F, left) Flow cytometry of intracellular BATF and c-Myc-GFP expression in GC B cells of c-Myc-GFP and wild-type mice. (right) Percentage of c-Myc-GFP+ populations in BATFhi and BATFlo LZ B cells of c-Myc-GFP mice and total LZ B cells of wild-type B cells. n = 3 biological replicates. (G) Flow cytometry of intracellular Foxo1 protein expression in BATFhi and BATFlo LZ GC B cells. Gray histogram, control signal in Foxo1 KO LZ B cells. Error bars represent SD. Data are from one experiment with three biological replicates (A), or representative of two independent experiments (B–G). *, P < 0.05; **, P < 0.01; ***, P < 0.001; unpaired Student’s t test.

