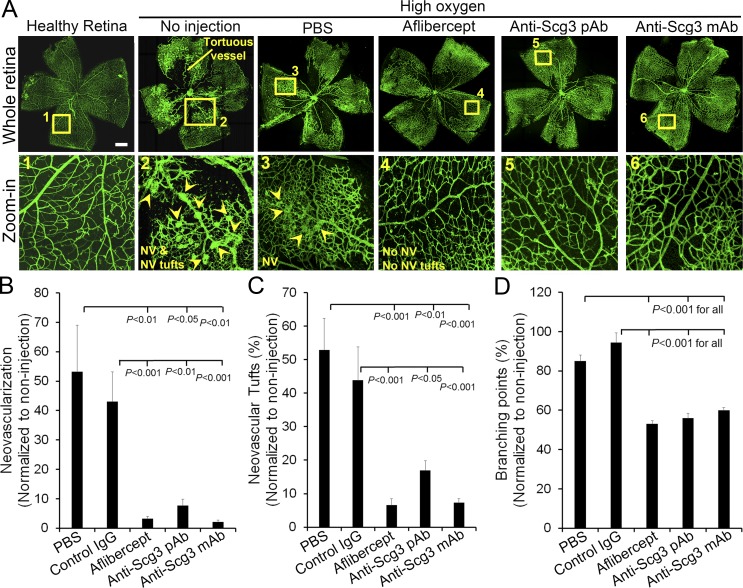
Figure 8.
Anti-Scg3 therapy of OIR. (A) Representative images of OIR. Arrowheads indicate neovascularization (NV) and neovascularization tufts. Doses are as in Fig. 7 F. Bar, 500 µm. (B) Quantification of neovascularization. (C) Quantification of neovascularization tuft number. (D) Quantification of branching points. n = 13 (PBS), 11 (control IgG), 12 (aflibercept), 11 (anti-Scg3 pAb), and 13 (anti-Scg3 mAb) eyes. This experiment was repeated twice in a blinded manner. Data are ±SEM. One-way ANOVA was used.

