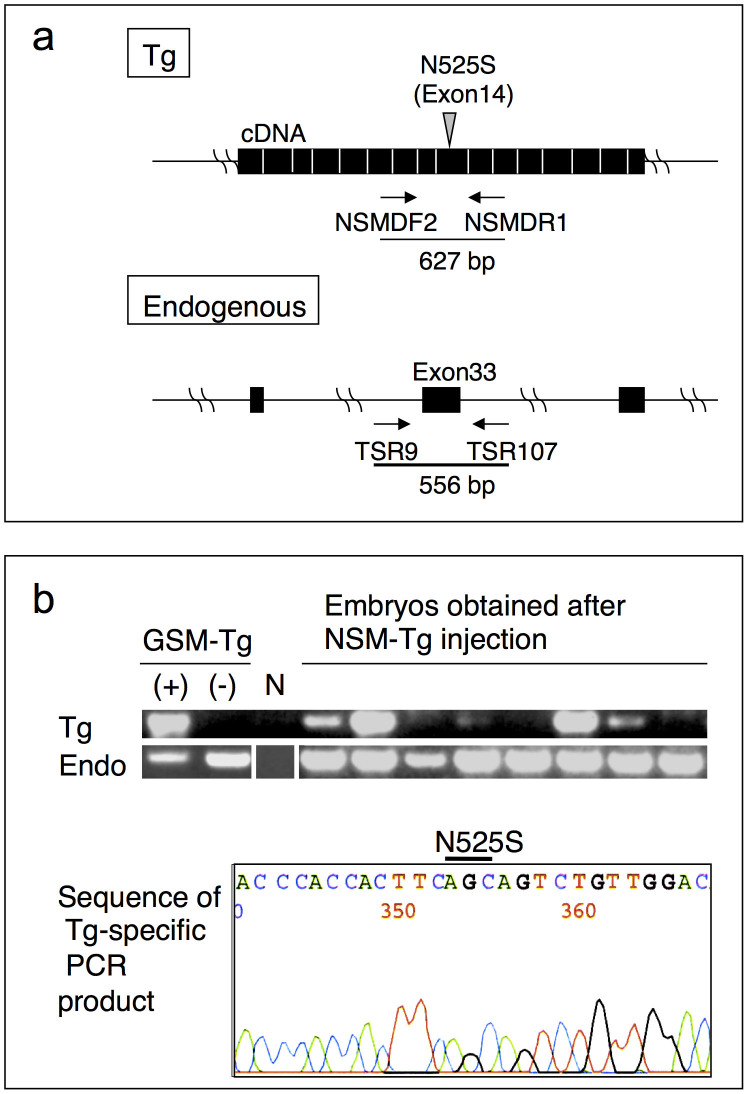
Figure 1. Detection of NSM Tg-positive embryos.
(a) Schematic diagram of the primers utilised for the Tg-specific and endogenous Tsc2-specific PCRs. Each filled box denotes the exon. (b) PCR genotyping results and sequencing analyses. Upper panel shows the PCR analysis of eight individual E10.5 embryos. DNAs from GSM Tg carrying (+) or non-carrying (−) rats were used as controls. Lane N indicates the template DNA negative control. Endogenous Tsc2 was amplified as the PCR control (Endo). The blots have been cropped focusing on the bands or interest; See Supplementary Fig. S1 for full-length gels. Lower panel shows the sequence of the Tg-specific PCR product. The position of the N525S mutation is indicated.

