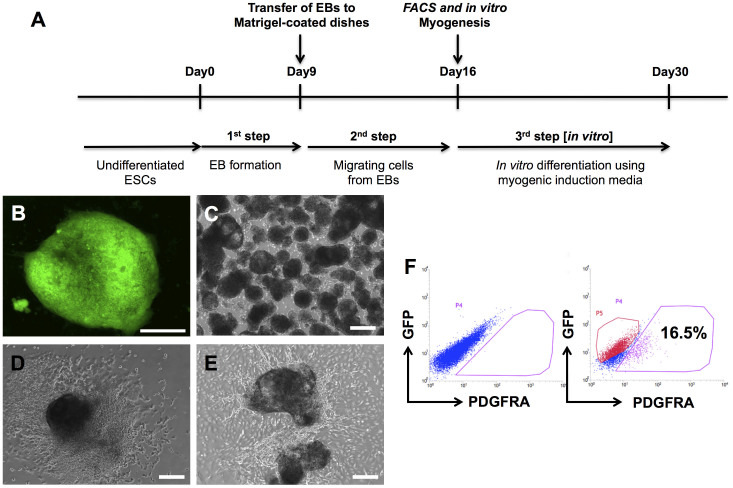
Figure 1. Derivation of PDGFRA+ cells from undifferentiated hESCs.
(A) Schematic describing the derivation of PDGFRA+ cells. (B) Undifferentiated hESC colony with OCT4-GFP expression. (C) EB formation. (D) EB attached to the Matrigel-coated plates. (E) Migrating cells from EBs. (F) Representative flow cytometric plots showing PDGFRA+ and OCT4-GFP− populations. Scale bar = 200 μm.

