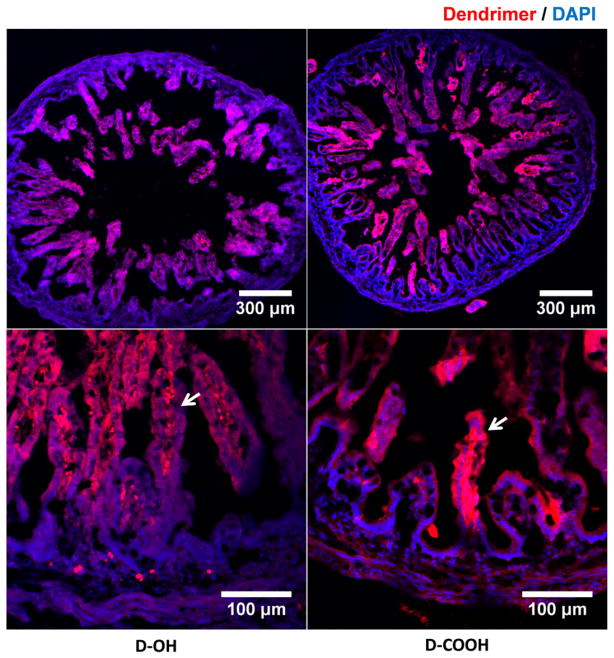
Fig. 2.
Immunofluorescence images demonstrate D-OH and D-COOH distribution in the small intestine. As shown in both lower magnification (top) and higher magnification images (bottom), at 24 h (G29) post administration, dendrimers (D-OH and D-COOH) transported across epithelium layer of intestinal villi and presented at the inner side of intestinal villi, indicating the partition of both dendrimers into the blood capillaries. Red: D-OH or D-COOH; blue: DAPI. Scale bar: top: 300 μm, bottom: 100 μm.

