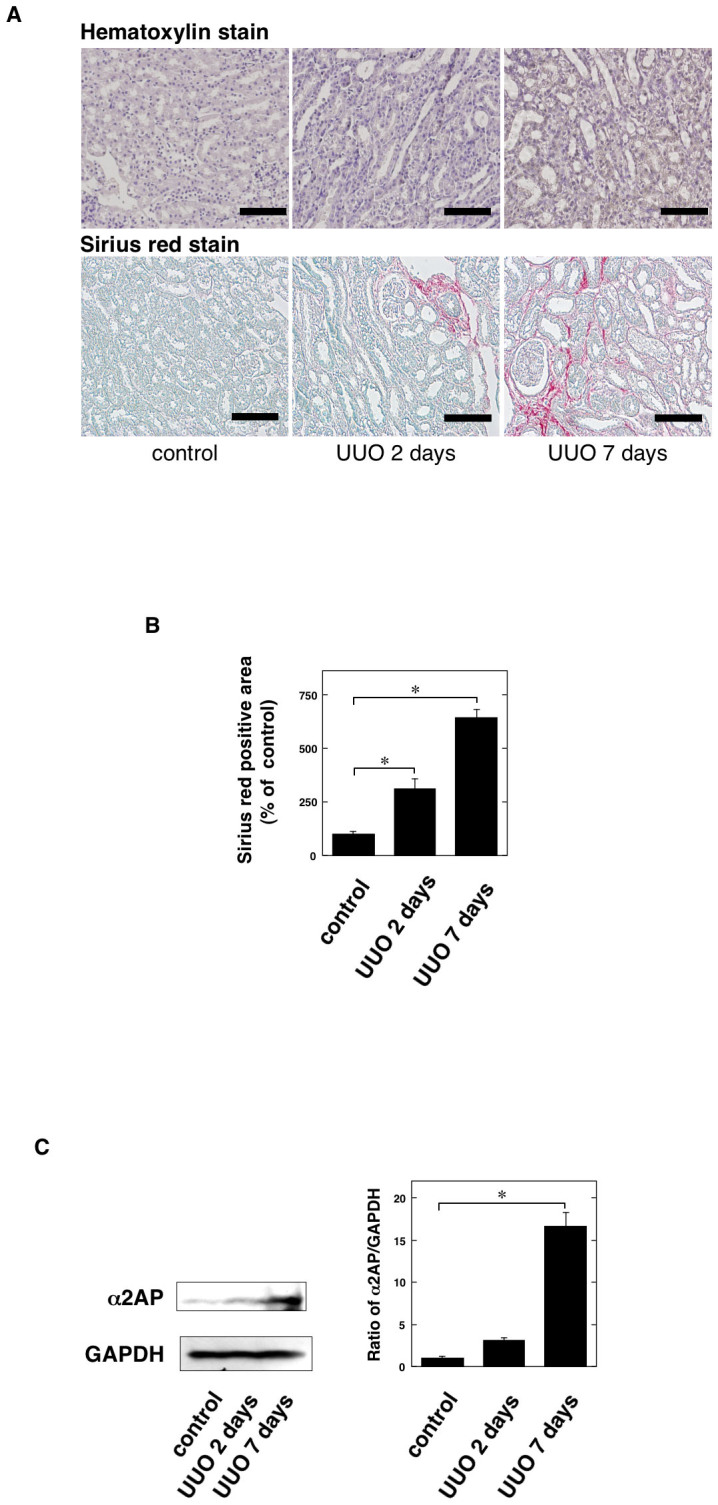
Figure 1. The accumulation of α2AP was induced in the obstructed kidneys.

(A) The kidneys at 2 and 7 days after UUO in the wild-type mice (hematoxylin stain and Sirius red stain). (B) The collagen content measured by Sirius red stain in the kidney of control and 2 and 7 days after UUO in the wild-type mice (n = 4). Sirius red positive area was expressed as a percent of the observed with control in the wild-type mice. (C) The expression of α2AP in the kidney of control and 2 and 7 days after UUO in mice was measured by a Western blot analysis. The blots were cropped, and the full-length blots are presented in the supplementary information. The histogram on the right panels shows quantitative representations of α2AP expression obtained from densitometry analysis (n = 3). The data represent the mean ± SEM. *; P < 0.01. Scale bar = 100 μm.
