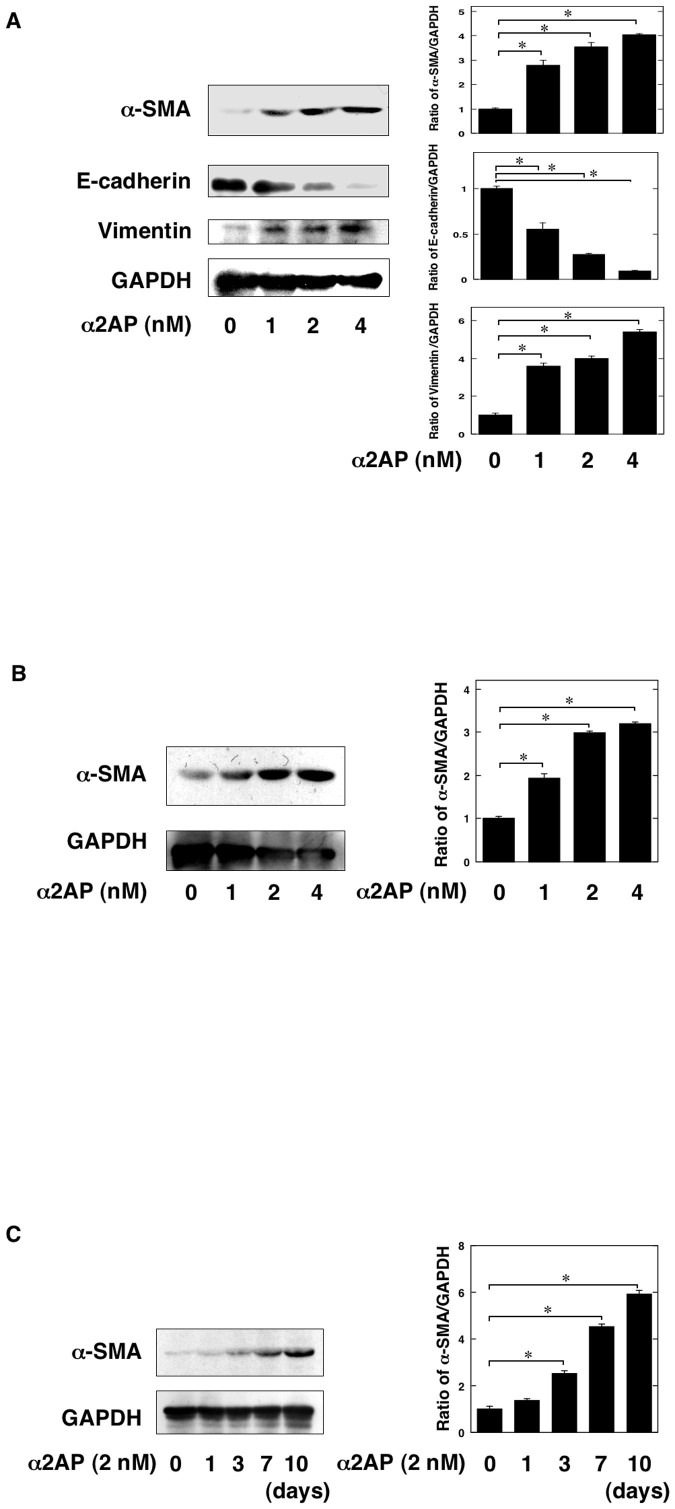
Figure 4. α2AP was associated with myofibroblast formation.
(A) The renal tubular epithelial cells were stimulated by α2AP (1, 2, 4 nM) for 24 hours. The expression of α-SMA, E-cadherin, vimentin was measured by a Western blot analysis. The blots were cropped, and the full-length blots are presented in the supplementary information. The histogram on the right panels shows quantitative representations of α-SMA, E-cadherin, vimentin expression obtained from densitometry analysis (n = 3). (B) The renal fibroblasts were stimulated by α2AP (1, 2, 4 nM) for 24 hours. The expression of α-SMA was measured by a Western blot analysis. The blots were cropped, and the full-length blots are presented in the supplementary information. The histogram on the right panels shows quantitative representations of α-SMA expression obtained from densitometry analysis (n = 3). (C) The mesenchymal stem cells were stimulated by α2AP (2 nM) for the indicated periods. The expression of α-SMA was measured by a Western blot analysis. The blots were cropped, and the full-length blots are presented in the supplementary information. The histogram on the right panels shows quantitative representations of α-SMA expression obtained from densitometry analysis (n = 3). The data represent the mean ± SEM. *; P < 0.01.

