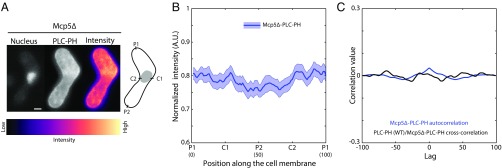
Fig. 3.
Preferential localization of PLC-PH to the cell centers is abolished in a cell devoid of Mcp5. (A) Confocal microscope images showing the maximum intensity projection of the Hoechst-stained nucleus (Left), the summed intensity projection (Center), and the intensity map (Right) of a Mcp5Δ cell expressing fluorescent PLC-PH (strain VA024; Table S1) and the schematic depicting the nucleus (gray), and locations P1, C1, P2, and C2 along the membrane of the cell. (Scale bar, 2 µm.) (B) The mean normalized intensity profile of PLC-PH (“Mcp5Δ-PLC-PH,” blue, n = 27 cells) along the positions P1, C1, P2, and C2 is plotted. The lighter shaded region depicts the SEM of the normalized intensity profile. The numbers in parentheses below the plot indicate the bin number (SI Materials and Methods for details). Unlike in Fig. 2B, PLC-PH’s membrane localization does not show preference to the center. (C) Autocorrelation analysis of PLC-PH signals (blue) exhibits no spatial periodicity. The cross-correlation analysis of wild-type PLC-PH and PLC-PH in Mcp5Δ background (black) does not show any significant correlation.

