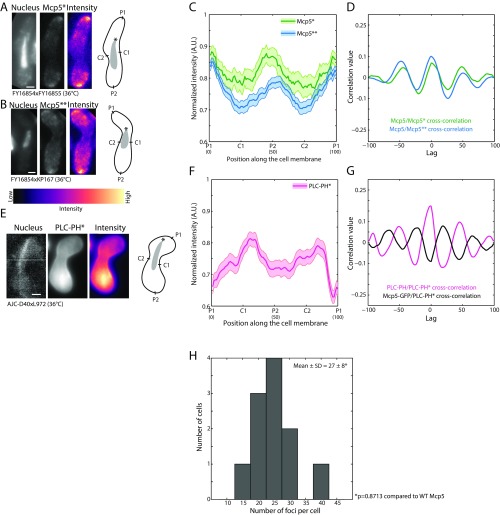
Fig. S3.
Mcp5 localization and clustering are unaffected in cells lacking its3-1 mutation grown at 36 °C. (A) Confocal microscope images showing the maximum intensity projection of the Hoechst-stained nucleus (Left), the summed intensity projection (Center), and intensity map (Right) of a cell expressing fluorescent Mcp5 at 36 °C (“Mcp5*,” strain FY16854 × FY16855; see Table S1) and the schematics depicting the locations P1, C1, P2, and C2 along the membrane of the cell. (B) Confocal microscope images showing the maximum intensity projection of the Hoechst-stained nucleus (Left), the summed intensity projection (Center), and intensity map (Right) of a cell expressing fluorescent Mcp5 at 36 °C (“Mcp5**,” strain FY16854 × KP167; see Table S1) and the schematics depicting the locations P1, C1, P2, and C2 along the membrane of the cell. The intensity range is shown below the images. (C) The mean normalized intensity profiles of Mcp5* (green, n = 13 cells) and Mcp5** (blue, n = 53 cells) along the positions P1, C1, P2, and C2 are plotted. The lighter shaded regions depict the SEM of the intensity profiles. The numbers in parentheses below the plot indicate the bin number (see SI Materials and Methods for details). Note that even though the Mcp5** signal is from a cross with the its3-1 strain at restrictive temperature, the FY16854 cell in the cross contains wild-type levels of PI(4, 5)P2 and hence displays Mcp5 profile similar to that of wild-type cells. (D) Cross-correlation analyses of Mcp5* signal (green) and Mcp5** signal (blue) with wild-type Mcp5 (see Fig. 2B) show high correlation at zero lag. (E) Confocal microscope images showing the maximum intensity projection of the Hoechst-stained nucleus (Left), the summed intensity projection (Center), and intensity map (Right) of a cell expressing fluorescent PLC-PH at 36 °C (“PLC-PH*,” strain AJC-D40 × L972; see Table S1) alongside the schematics depicting the locations P1, C1, P2, and C2 on the membrane of the cell. (F) The mean normalized intensity profile of PLC-PH* (magenta, n = 37 cells) along the positions P1, C1, P2, and C2 is plotted. The lighter shaded region depicts the SEM of the intensity profile. The numbers in parentheses below the plot indicate the bin number (see SI Materials and Methods for details). (G) Cross-correlation analysis of PLC-PH* with wild-type PLC-PH (magenta, see Fig. 2B) shows highest correlation at zero lag, and that with wild-type Mcp5 (black, see Fig. 2B) shows inverse correlation at zero lag similar to that seen in Fig. 2C. The asterisk marks the position of the SPB with respect to the nucleus (gray). (Scale bar, 2 µm.) (H) Histogram of number of Mcp5 foci counted per cell versus number of cells with given number of foci in cells expressing fluorescent Mcp5 grown at 36 °C (strain FY16854 × FY16855; see Table S1). The mean ± SD of the number of foci per cell was estimated to be 27 ± 8 (n = 11 cells).

