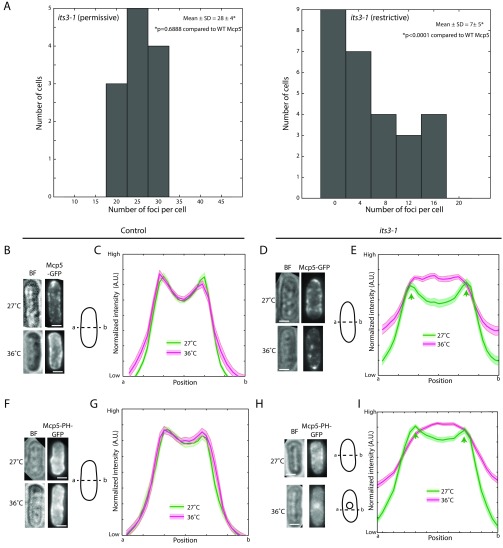
Fig. S4.
Mcp5 clustering is perturbed in PI(4,5)P2-depleted cells. (A) Histograms of number of Mcp5 foci counted per cell versus number of cells with given number of foci in its3-1 cells grown at 27 °C (Left) and at 36 °C (Right) (strain KP167 × VA026; see Table S1). The mean ± SD of the number of foci per cell in control cells (Left) was estimated to be 28 ± 4 (n = 12 cells), and that in cells where PI(4,5)P2 was depleted (Right) was estimated to be 7 ± 5 (n = 27 cells). (B) Bright-field image (“BF”; Top and Bottom Left) and the maximum intensity projections of Mcp5-GFP (Top and Bottom Right) of a control cell (strain FY15622 transformed with plasmid FYP2932; see Table S1) imaged using confocal microscopy at permissive temperature of 27 °C (Top) and restrictive temperature of 36 °C (Bottom), alongside the schematic of a cell with line ab, along which the intensity profile of the interphase cell is plotted. (C) The mean normalized intensity profile of Mcp5-GFP along the positions a–b is plotted at permissive (green, n = 31 cells) and restrictive (magenta, n = 32 cells) temperatures. The lighter shaded regions depict the SEM of the intensity profiles. (D) Bright-field image (BF; Top and Bottom Left) and the maximum intensity projections of Mcp5-GFP (Top and Bottom Right) of an its3-1 cell (strain KP167 transformed with plasmid FYP2932; see Table S1) imaged using confocal microscopy at permissive temperature of 27 °C (Top) and restrictive temperature of 36 °C (Bottom), alongside the schematic of a cell with line ab along which the intensity profile of the interphase cell is plotted. (E) The mean normalized intensity profile of Mcp5-GFP expressed in its3-1 zygotes along the positions a–b is plotted at permissive (green) and restrictive (magenta) temperatures (n = 37 and 36 cells, respectively). The lighter shaded regions depict the SEM of the intensity profiles. Although Mcp5 showed robust localization to the membrane at permissive temperatures (green arrows), perturbation of PI(4,5)P2 displaced Mcp5 from the cortex at restrictive temperature. (F) Bright-field image (BF; Top and Bottom Left) and the maximum intensity projections of Mcp5-PH-GFP (Top and Bottom Right) of a control cell (strain FY15622 transformed with plasmid FYP2934; see Table S1) imaged using confocal microscopy at permissive temperature of 27 °C (Top) and restrictive temperature of 36 °C (Bottom), alongside the schematic of a cell with the line ab, along which the intensity profile of the interphase cell is plotted. (G) The mean normalized intensity profile of Mcp5-PH-GFP along the positions a–b at permissive (green, n = 29 cells) and restrictive temperatures (magenta, n = 22 cells) is plotted. The lighter shaded regions depict the SEM of the intensity profiles. Note that there is no significant change in the localization of either Mcp5 or Mcp5-PH-GFP at restrictive temperatures in this control background. (H) Bright-field image (BF; Top and Bottom Left) and the maximum intensity projections of Mcp5-PH-GFP (Top and Bottom Right) of an its3-1 cell (strain KP167 transformed with plasmid FYP2934; see Table S1) imaged using confocal microscopy at permissive temperature of 27 °C (Top) and restrictive temperature of 36 °C (Bottom), alongside the schematic of the cell with line ab along which the intensity profile of the interphase cell is plotted. At restrictive temperature, Mcp5-PH-GFP showed increased localization at the nucleus; therefore, a line running just below the nucleus was chosen so as to avoid interference. (I) The mean normalized intensity profile of Mcp5-PH-GFP along the positions a–b at permissive (green) and restrictive temperatures (magenta) is plotted (n = 27 and 34 cells, respectively). The lighter shaded regions depict the SEM of the intensity profiles. Two distinct peaks (green arrows) can be seen at the its3-1 cell boundaries where PH-GFP accumulates at permissive temperatures, whereas these peaks disappear at restrictive temperature due to relocalization of Mcp5-PH-GFP to the cell interior. (Scale bar, 2 µm.)

