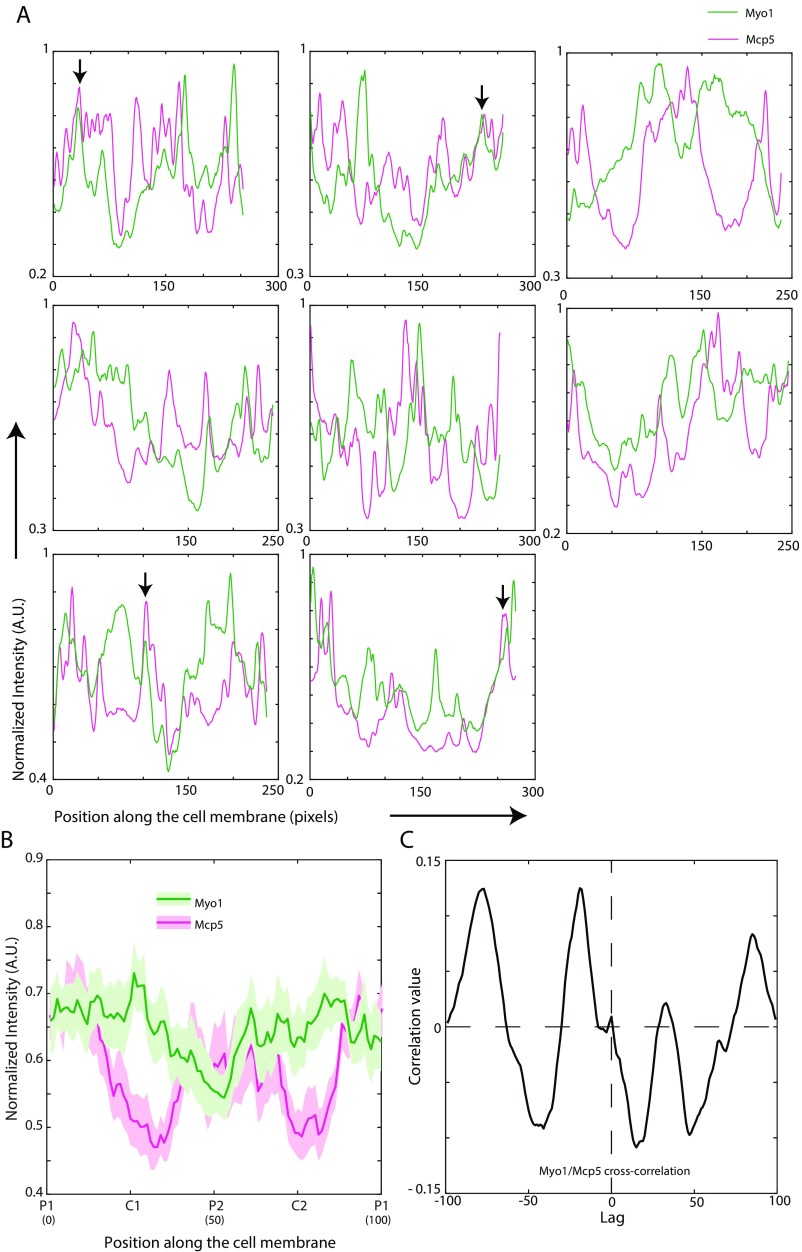
Fig. S5.
Myo1 and Mcp5 do not exhibit significant colocalization. (A) Plots of normalized Myo1 (green) and Mcp5 (magenta) signal along the membrane of eight different cells (strain VA046; see Table S1). Colocalization of the signals was seen in some instances, and representative examples are marked with black arrows. (B) The mean normalized intensity profiles of Mcp5 (magenta) and Myo1 (green) along the membrane, expressed in the same cell, are plotted (n = 10 cells, strain VA046; see Table S1). The lighter shaded regions depict the SEM of the intensity profiles. The numbers in parentheses below the plot indicate the bin number (see SI Materials and Methods for details). (C) Cross-correlation of Mcp5 and Myo1 intensities (black) indicated low correlation value at zero lag—that is, low colocalization.

