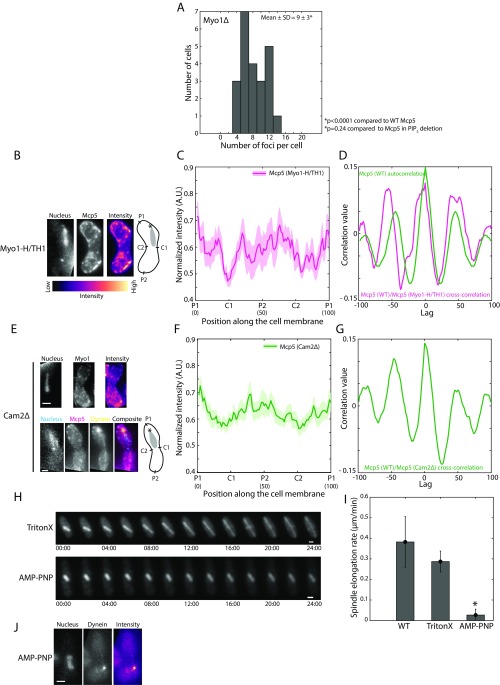
Fig. S6.
Mcp5’s preferential localization at the poles does not require Myo1’s motor activity. (A) Histogram of number of Mcp5 foci counted per cell versus number of cells with given number of foci in Myo1Δ zygotes (strain VA044xVA045; see Table S1). The mean ± SD of the number of foci per cell was estimated to be 9 ± 3 (n = 23 cells). (B) Fluorescence microscope images showing the maximum intensity projection of the Hoechst-stained nucleus (Left), the summed intensity projection (Center), and intensity map (Right) of a Myo1-H/TH1 cell expressing fluorescent Mcp5 (strain VA053; see Table S1) and the schematics depicting the locations P1, C1, P2, and C2 along the membrane of the cell. The intensity range is shown below the images. (C) The mean normalized intensity profile of Mcp5 in Myo1-H/TH1 background (magenta, n = 9 cells) along the positions P1, C1, P2, and C2 is plotted. The lighter shaded regions depict the SEM of the intensity profiles. The numbers in parentheses below the plot indicate the bin number (see SI Materials and Methods for details). (D) Autocorrelation of wild-type Mcp5 signal [strain AY277; see Table S1, “Mcp5 (WT),” green] shows spatial periodicity as observed before. Cross-correlation analysis of wild-type Mcp5 signal and that of Mcp5 signal in Myo1-H/TH1 strain (magenta) shows a similar trend as that seen in the wild-type Mcp5 autocorrelation. (E) Fluorescence microscope images showing the maximum intensity projection of the Hoechst-stained nucleus (Left), the summed intensity projection (Second From Left), and intensity map (Third From Left) of Cam2Δ cells expressing fluorescent Myo1 (Top, strain FY16951; see Table S1) and Mcp5 (Bottom, magenta) and dynein (Bottom, yellow, strain VA051; see Table S1) and the schematics depicting the locations P1, C1, P2, and C2 along the membrane of the cell. (F) The mean normalized intensity profile of Mcp5 in Cam2Δ cells (green, n = 13 cells) along the positions P1, C1, P2, and C2 is plotted. The lighter shaded regions depict the SEM of the intensity profile. The numbers in parentheses below the plot indicate the bin number (see SI Materials and Methods for details). (G) Cross-correlation analysis of wild-type Mcp5 signal and that of Mcp5 signal in Cam2Δ background (green) shows a similar trend as that seen in the wild-type Mcp5 autocorrelation in D. (H) Montage of spindle elongation in cells with fluorescent tubulin (strain KI001; see Table S1) treated with TritonX-100 (Top) and AMP–PNP (Bottom) and imaged for 24 min. The numbers below the montages depict time (mm:ss). (I) Plot of spindle elongation rate in control (WT, n = 8 cells), TritonX-100–treated (TritonX, n = 4 cells), and AMP–PNP-treated (AMP–PNP, n = 7 cells) cells. The TritonX-100–treated cells elongate at a rate that is not significantly different from that of control cells, whereas the elongation of the spindle in AMP–PNP-treated cells is severely reduced. (J) Fluorescence image of the Hoechst-stained nucleus (Left), maximum intensity projection of the fluorescently labeled dynein (Center, strain SV91; see Table S1), and intensity map of the dynein fluorescence (Right) depicting the complete loss of cortical dynein foci in AMP–PNP-treated cells (n= 13 cells). In the schematics, the asterisk marks the position of the SPB with respect to the nucleus (gray). (Scale bar, 2 µm.)

